
Homework Answers
| j | No of times interest was earned | 2019 | 2018 | |||
| No of times interest was earned | Earning before interest and taxes | 89,000 | 93,000 | |||
| Interest expenses | 9,500 | 8,700 | ||||
| No of times interest was earned | 9.37 | 10.69 | ||||
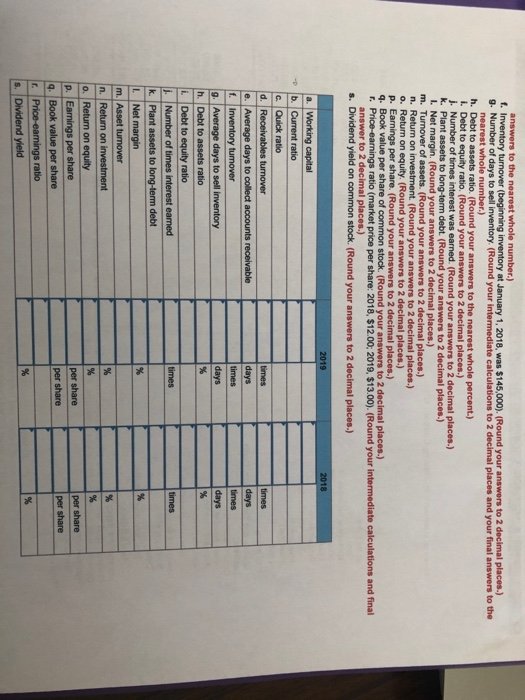
| Note:-1 | Cell Reference | Earning before interest and taxes | 2019 | 2018 | ||
| A | Net Earning | 31,500 | 37,300 | |||
| B | Income tax expenses | 48,000 | 47,000 | |||
| C | Interest expenses | 9,500 | 8,700 | |||
| D=A+B+C | Earning before interest and taxes | 89,000 | 93,000 | |||
| p | Earning Per share | 2019 | 2018 | |||
| Income Attributable to common stock holder | 27,500 | 33,300 | ||||
| Weighted average no of common shares during the year | 10,000 | 10,000 | ||||
| Earning Per share | 2.75 | 3.33 | ||||
| Cell Reference | Income Attributable to common stock holder | 2019 | 2018 | |||
| A | Net Earning | 31,500 | 37,300 | |||
| B | Preferred stock dividend | 4,000 | 4,000 | |||
| C=A-B | Income Attributable to common stock holder | 27,500 | 33,300 | |||
| q | Book Value per share of common stock | 2019 | 2018 | |||
| Stockholder equity-Preferred stock | =281,000-80,000 | =256,900-80,000 | ||||
| No of common stock outstanding | 10,000 | 10,000 | ||||
| Book Value per share of common stock | 201,000 | 176,900 | ||||
| 10,000 | 10,000 | |||||
| Book Value per share of common stock | 20.10 | 17.69 | ||||
| r | Price Earning ratio | 2019 | 2018 | |||
| Market price per share | 13 | 12 | ||||
| Earning per share | 2.75 | 3.33 | ||||
| Price Earning ratio | 4.73 | 3.60 | ||||
Add Answer to:
hello , can someone help me with the question
J P Q R and S
Financial...
can someone help me for the question S . the last qustion thank you Financial statements...
 can someone help me for the question S . the last
qustion
thank you
Financial statements for Fanning Company follow FANNING COMPANY Balance Sheets As of December 31 2019 2018 25.000 241,000 208.000 280,000 31,000 $584 000 26.000 $524 000 $ Current assets Cash Marketable securities Accounts receivable net) Inventories Prepaid items Total current assets Investments Plant (net) Land Total assets Liabilities and Stockholders' Equity Liabilities Current liable Notes payable Accounts payable Salaries payable Total current a s Noncurrenties Bonds...
can someone help me for the question S . the last
qustion
thank you
Financial statements for Fanning Company follow FANNING COMPANY Balance Sheets As of December 31 2019 2018 25.000 241,000 208.000 280,000 31,000 $584 000 26.000 $524 000 $ Current assets Cash Marketable securities Accounts receivable net) Inventories Prepaid items Total current assets Investments Plant (net) Land Total assets Liabilities and Stockholders' Equity Liabilities Current liable Notes payable Accounts payable Salaries payable Total current a s Noncurrenties Bonds...
can someone help me with f g h i j k l m n o p...
 can someone help me with
f g h i j k l m n o p q r s please
Financial statements for Fanning Company follow FANNING COMPANY Balance Sheets As of December 31 2019 2018 25.000 241,000 208.000 280,000 31,000 $584 000 26.000 $524 000 $ Current assets Cash Marketable securities Accounts receivable net) Inventories Prepaid items Total current assets Investments Plant (net) Land Total assets Liabilities and Stockholders' Equity Liabilities Current liable Notes payable Accounts payable Salaries payable...
can someone help me with
f g h i j k l m n o p q r s please
Financial statements for Fanning Company follow FANNING COMPANY Balance Sheets As of December 31 2019 2018 25.000 241,000 208.000 280,000 31,000 $584 000 26.000 $524 000 $ Current assets Cash Marketable securities Accounts receivable net) Inventories Prepaid items Total current assets Investments Plant (net) Land Total assets Liabilities and Stockholders' Equity Liabilities Current liable Notes payable Accounts payable Salaries payable...
can someone help me with M and N please thank you Financial statements for Fanning Company...
 can someone help me with M and N please
thank you
Financial statements for Fanning Company follow FANNING COMPANY Balance Sheets As of December 31 2019 2018 25.000 241,000 208.000 280,000 31,000 $584 000 26.000 $524 000 $ Current assets Cash Marketable securities Accounts receivable net) Inventories Prepaid items Total current assets Investments Plant (net) Land Total assets Liabilities and Stockholders' Equity Liabilities Current liable Notes payable Accounts payable Salaries payable Total current a s Noncurrenties Bonds payable Other Total...
can someone help me with M and N please
thank you
Financial statements for Fanning Company follow FANNING COMPANY Balance Sheets As of December 31 2019 2018 25.000 241,000 208.000 280,000 31,000 $584 000 26.000 $524 000 $ Current assets Cash Marketable securities Accounts receivable net) Inventories Prepaid items Total current assets Investments Plant (net) Land Total assets Liabilities and Stockholders' Equity Liabilities Current liable Notes payable Accounts payable Salaries payable Total current a s Noncurrenties Bonds payable Other Total...
can someone help me Financial statements for Fanning Company follow FANNING COMPANY Balance Sheets As of...
 can someone help me
Financial statements for Fanning Company follow FANNING COMPANY Balance Sheets As of December 31 2019 2018 25.000 241,000 208.000 280,000 31,000 $584 000 26.000 $524 000 $ Current assets Cash Marketable securities Accounts receivable net) Inventories Prepaid items Total current assets Investments Plant (net) Land Total assets Liabilities and Stockholders' Equity Liabilities Current liable Notes payable Accounts payable Salaries payable Total current a s Noncurrenties Bonds payable Other Total noncurrent abilities Total liabilities Stockholders' equity Preferred...
can someone help me
Financial statements for Fanning Company follow FANNING COMPANY Balance Sheets As of December 31 2019 2018 25.000 241,000 208.000 280,000 31,000 $584 000 26.000 $524 000 $ Current assets Cash Marketable securities Accounts receivable net) Inventories Prepaid items Total current assets Investments Plant (net) Land Total assets Liabilities and Stockholders' Equity Liabilities Current liable Notes payable Accounts payable Salaries payable Total current a s Noncurrenties Bonds payable Other Total noncurrent abilities Total liabilities Stockholders' equity Preferred...
can someone help me with G H I and O please Financial statements for Fanning Company...
 can someone help me with
G H I and O please
Financial statements for Fanning Company follow FANNING COMPANY Balance Sheets As of December 31 2019 2018 25.000 241,000 208.000 280,000 31,000 $584 000 26.000 $524 000 $ Current assets Cash Marketable securities Accounts receivable net) Inventories Prepaid items Total current assets Investments Plant (net) Land Total assets Liabilities and Stockholders' Equity Liabilities Current liable Notes payable Accounts payable Salaries payable Total current a s Noncurrenties Bonds payable Other Total...
can someone help me with
G H I and O please
Financial statements for Fanning Company follow FANNING COMPANY Balance Sheets As of December 31 2019 2018 25.000 241,000 208.000 280,000 31,000 $584 000 26.000 $524 000 $ Current assets Cash Marketable securities Accounts receivable net) Inventories Prepaid items Total current assets Investments Plant (net) Land Total assets Liabilities and Stockholders' Equity Liabilities Current liable Notes payable Accounts payable Salaries payable Total current a s Noncurrenties Bonds payable Other Total...
i need help with G and O -For G 2018 its NOT 430 or 439 For...
 i need help with G and O
-For G 2018
its NOT 430 or 439
For G 2019
its NOT 352 or 342
-For O 2019
its NOT 11.21%or 7.93%or 5.85%
Financial statements for Fanning Company follow FANNING COMPANY Balance Sheets As of December 31 2018 2019 Assets Current assets Cash Marketable securities Accounts receivable (net) Inventories Prepaid items Total ourrent assets Investments Plant (net) Land $ 14,500 6,500 38,000 139.000 10.000 208.000 25.000 265,000 26.000 $ 18.500 20.500 46.000...
i need help with G and O
-For G 2018
its NOT 430 or 439
For G 2019
its NOT 352 or 342
-For O 2019
its NOT 11.21%or 7.93%or 5.85%
Financial statements for Fanning Company follow FANNING COMPANY Balance Sheets As of December 31 2018 2019 Assets Current assets Cash Marketable securities Accounts receivable (net) Inventories Prepaid items Total ourrent assets Investments Plant (net) Land $ 14,500 6,500 38,000 139.000 10.000 208.000 25.000 265,000 26.000 $ 18.500 20.500 46.000...
I need help with K. through S. PLEASE! Financial statements for Solomon Company follow. SOLOMON COMPANY...
I need help with K. through S. PLEASE! Financial statements for Solomon Company follow. SOLOMON COMPANY Balance Sheets As of December 31 2019 2018 Assets Current assets Cash $ 23,000 $ 19,000 Marketable securities 21,400 7,400 Accounts receivable (net) 55,000 47,000 Inventories 140,000 148,000 Prepaid items 29,000 14,000 Total current assets 268,400 235,400 Investments 32,000 25,000 Plant (net) 280,000 265,000 Land 32,000 27,000 Total assets $ 612,400 $ 552,400 Liabilities and Stockholders’ Equity Liabilities Current liabilities Notes payable $ 35,400...
I need help with e. through s. PLEASE! Financial statements for Solomon Company follow. SOLOMON COMPANY...
I need help with e. through s. PLEASE! Financial statements for Solomon Company follow. SOLOMON COMPANY Balance Sheets As of December 31 2019 2018 Assets Current assets Cash $ 23,000 $ 19,000 Marketable securities 21,400 7,400 Accounts receivable (net) 55,000 47,000 Inventories 140,000 148,000 Prepaid items 29,000 14,000 Total current assets 268,400 235,400 Investments 32,000 25,000 Plant (net) 280,000 265,000 Land 32,000 27,000 Total assets $ 612,400 $ 552,400 Liabilities and Stockholders’ Equity Liabilities Current liabilities Notes payable $ 35,400...
Financial statements for Vernon Company follow. VERNON COMPANY Balance Sheets As of December 31 2019 2018...
 Financial statements for Vernon Company follow. VERNON COMPANY Balance Sheets As of December 31 2019 2018 $ 24,500 21,700 58,000 143,000 27,000 274,200 32,000 295,000 27,000 $628,200 $ 20,500 7,700 50,000 151,000 12,000 241,200 25,000 280,000 22,000 $568,200 Assets Current assets Cash Marketable securities Accounts receivable (net) Inventories Prepaid items Total current assets Investments Plant (net) Land Total assets Liabilities and Stockholders' Equity Liabilities Current liabilities Notes payable Accounts payable Salaries payable Total current liabilities Noncurrent liabilities Bonds payable Other...
Financial statements for Franklin Company follow. FRANKLIN COMPANY Balance Sheets As of December 31 2019 2018...
Financial statements for Franklin Company follow. FRANKLIN COMPANY Balance Sheets As of December 31 2019 2018 Assets Current assets Cash $ 19,500 $ 15,500 Marketable securities 20,700 6,700 Accounts receivable (net) 48,000 40,000 Inventories 133,000 141,000 Prepaid items 27,000 12,000 Total current assets 248,200 215,200 Investments 22,000 15,000 Plant (net) 290,000 275,000 Land 33,000 28,000 Total assets $ 593,200 $ 533,200 Liabilities and Stockholders’ Equity Liabilities Current liabilities Notes payable $ 31,200 $ 18,200 Accounts payable 133,800 120,000 Salaries payable...
 can someone help me for the question S . the last
qustion
thank you
Financial statements for Fanning Company follow FANNING COMPANY Balance Sheets As of December 31 2019 2018 25.000 241,000 208.000 280,000 31,000 $584 000 26.000 $524 000 $ Current assets Cash Marketable securities Accounts receivable net) Inventories Prepaid items Total current assets Investments Plant (net) Land Total assets Liabilities and Stockholders' Equity Liabilities Current liable Notes payable Accounts payable Salaries payable Total current a s Noncurrenties Bonds...
can someone help me for the question S . the last
qustion
thank you
Financial statements for Fanning Company follow FANNING COMPANY Balance Sheets As of December 31 2019 2018 25.000 241,000 208.000 280,000 31,000 $584 000 26.000 $524 000 $ Current assets Cash Marketable securities Accounts receivable net) Inventories Prepaid items Total current assets Investments Plant (net) Land Total assets Liabilities and Stockholders' Equity Liabilities Current liable Notes payable Accounts payable Salaries payable Total current a s Noncurrenties Bonds...
 can someone help me with
f g h i j k l m n o p q r s please
Financial statements for Fanning Company follow FANNING COMPANY Balance Sheets As of December 31 2019 2018 25.000 241,000 208.000 280,000 31,000 $584 000 26.000 $524 000 $ Current assets Cash Marketable securities Accounts receivable net) Inventories Prepaid items Total current assets Investments Plant (net) Land Total assets Liabilities and Stockholders' Equity Liabilities Current liable Notes payable Accounts payable Salaries payable...
can someone help me with
f g h i j k l m n o p q r s please
Financial statements for Fanning Company follow FANNING COMPANY Balance Sheets As of December 31 2019 2018 25.000 241,000 208.000 280,000 31,000 $584 000 26.000 $524 000 $ Current assets Cash Marketable securities Accounts receivable net) Inventories Prepaid items Total current assets Investments Plant (net) Land Total assets Liabilities and Stockholders' Equity Liabilities Current liable Notes payable Accounts payable Salaries payable...
 can someone help me with M and N please
thank you
Financial statements for Fanning Company follow FANNING COMPANY Balance Sheets As of December 31 2019 2018 25.000 241,000 208.000 280,000 31,000 $584 000 26.000 $524 000 $ Current assets Cash Marketable securities Accounts receivable net) Inventories Prepaid items Total current assets Investments Plant (net) Land Total assets Liabilities and Stockholders' Equity Liabilities Current liable Notes payable Accounts payable Salaries payable Total current a s Noncurrenties Bonds payable Other Total...
can someone help me with M and N please
thank you
Financial statements for Fanning Company follow FANNING COMPANY Balance Sheets As of December 31 2019 2018 25.000 241,000 208.000 280,000 31,000 $584 000 26.000 $524 000 $ Current assets Cash Marketable securities Accounts receivable net) Inventories Prepaid items Total current assets Investments Plant (net) Land Total assets Liabilities and Stockholders' Equity Liabilities Current liable Notes payable Accounts payable Salaries payable Total current a s Noncurrenties Bonds payable Other Total...
 can someone help me
Financial statements for Fanning Company follow FANNING COMPANY Balance Sheets As of December 31 2019 2018 25.000 241,000 208.000 280,000 31,000 $584 000 26.000 $524 000 $ Current assets Cash Marketable securities Accounts receivable net) Inventories Prepaid items Total current assets Investments Plant (net) Land Total assets Liabilities and Stockholders' Equity Liabilities Current liable Notes payable Accounts payable Salaries payable Total current a s Noncurrenties Bonds payable Other Total noncurrent abilities Total liabilities Stockholders' equity Preferred...
can someone help me
Financial statements for Fanning Company follow FANNING COMPANY Balance Sheets As of December 31 2019 2018 25.000 241,000 208.000 280,000 31,000 $584 000 26.000 $524 000 $ Current assets Cash Marketable securities Accounts receivable net) Inventories Prepaid items Total current assets Investments Plant (net) Land Total assets Liabilities and Stockholders' Equity Liabilities Current liable Notes payable Accounts payable Salaries payable Total current a s Noncurrenties Bonds payable Other Total noncurrent abilities Total liabilities Stockholders' equity Preferred...
 can someone help me with
G H I and O please
Financial statements for Fanning Company follow FANNING COMPANY Balance Sheets As of December 31 2019 2018 25.000 241,000 208.000 280,000 31,000 $584 000 26.000 $524 000 $ Current assets Cash Marketable securities Accounts receivable net) Inventories Prepaid items Total current assets Investments Plant (net) Land Total assets Liabilities and Stockholders' Equity Liabilities Current liable Notes payable Accounts payable Salaries payable Total current a s Noncurrenties Bonds payable Other Total...
can someone help me with
G H I and O please
Financial statements for Fanning Company follow FANNING COMPANY Balance Sheets As of December 31 2019 2018 25.000 241,000 208.000 280,000 31,000 $584 000 26.000 $524 000 $ Current assets Cash Marketable securities Accounts receivable net) Inventories Prepaid items Total current assets Investments Plant (net) Land Total assets Liabilities and Stockholders' Equity Liabilities Current liable Notes payable Accounts payable Salaries payable Total current a s Noncurrenties Bonds payable Other Total...
 i need help with G and O
-For G 2018
its NOT 430 or 439
For G 2019
its NOT 352 or 342
-For O 2019
its NOT 11.21%or 7.93%or 5.85%
Financial statements for Fanning Company follow FANNING COMPANY Balance Sheets As of December 31 2018 2019 Assets Current assets Cash Marketable securities Accounts receivable (net) Inventories Prepaid items Total ourrent assets Investments Plant (net) Land $ 14,500 6,500 38,000 139.000 10.000 208.000 25.000 265,000 26.000 $ 18.500 20.500 46.000...
i need help with G and O
-For G 2018
its NOT 430 or 439
For G 2019
its NOT 352 or 342
-For O 2019
its NOT 11.21%or 7.93%or 5.85%
Financial statements for Fanning Company follow FANNING COMPANY Balance Sheets As of December 31 2018 2019 Assets Current assets Cash Marketable securities Accounts receivable (net) Inventories Prepaid items Total ourrent assets Investments Plant (net) Land $ 14,500 6,500 38,000 139.000 10.000 208.000 25.000 265,000 26.000 $ 18.500 20.500 46.000...
 Financial statements for Vernon Company follow. VERNON COMPANY Balance Sheets As of December 31 2019 2018 $ 24,500 21,700 58,000 143,000 27,000 274,200 32,000 295,000 27,000 $628,200 $ 20,500 7,700 50,000 151,000 12,000 241,200 25,000 280,000 22,000 $568,200 Assets Current assets Cash Marketable securities Accounts receivable (net) Inventories Prepaid items Total current assets Investments Plant (net) Land Total assets Liabilities and Stockholders' Equity Liabilities Current liabilities Notes payable Accounts payable Salaries payable Total current liabilities Noncurrent liabilities Bonds payable Other...
Most questions answered within 3 hours.
-
HACKING
1: Discuss the tricks of hacking in 300 words.
2: Explain in you own words...
asked 5 minutes ago -
The equilibrium constant Kp for the reaction
C(s)+H2O(g)⇌CO(g)+H2(g) is 2.44 at 1000 K. What are the...
asked 4 minutes ago -
Answer the following questions about the NOCl molecule. There
are [?] single bonds in this molecule....
asked 3 minutes ago -
The range of frequencies included in an RF pulse is referred to
as it's bandwidth (BW)....
asked 6 minutes ago -
In the context of the 55 principles, _________
means to keep a process going through training,...
asked 17 minutes ago -
Can you write a 400 words paragraph about investigation on
permeability of cell membrane for SDS,...
asked 17 minutes ago -
This question is regarding Computer Security;
What do you think are some other security risks and...
asked 25 minutes ago -
Assume that you work for an organization that has around 10,000
desktops/laptops and approximately 1,000 servers...
asked 33 minutes ago -
An electron moves along the z-axis with vz=5.2×10^7m/s.
As it passes the origin, what are the...
asked 36 minutes ago -
Silly-Sort(A,i,j)
if A[i] > A[j]
then exchange A[i] and A[j];
if i+1 >= j
then return;...
asked 39 minutes ago -
Discuss the major contributions of Max Weber in understanding
the society theoretically. [10]
asked 42 minutes ago -
The rate constant for a certain reaction is k =
8.50×10⁻³ s−1 . If the initial...
asked 53 minutes ago