
Homework Answers
First thing , use average only in 2019 not in 2018
Assuming 360 days
g. Number of days to sell inventory
2019
Average stock in trade = ($131,000 + $139,000)/2
=$135,000
Cost of goods sold = $140,000
Number of days to sell inventory = (Average stock in trade /cost of goods sold)* 360 days
Number of days to sell inventory =( $135,000/$140,000)* 360 Days
= 347.14 (Rounded off)
Final answer in nearest whole number = 347 Days
2018
Since no figures for 2017 are given , we will not compute by average
Stock in trade = $139,000
Cost of goods sold =$118,000
Number of days to sell inventory = (stock in trade /cost of goods sold)* 360 days
=($139,000/$118,000)*360
=424.07 days ( Rounded off )
Final answer in nearest whole number = 424 days
Now, What mistakes you did
For 2018
You might have solved the Number of days to sell inventory by taking 365 days or there can be a mistake in rounding off and the whole number. If you took 365 days still 430 days is incorrect. If we solve by taking 365 days the answer will be 429.96 ( rounded off) and then whole number 429 days ( final answer)
Taking 365 days is not wrong but there can be difference in the answer
For 2019
Similarly,
If you solve this by taking 365 days still 352 days is incorrect. if we solve by taking 365 days the answer will be 351.96( rounded off ) and then whole number 351 days ( final answer)
Taking 365 days is not wrong but there can be difference in answer
First round off ( two decimal) then take whole number
o. Return on equity
2019
Net income = $31,500
Average shareholder's funds = $281,000+$256,900/2
=$268,950
Return on equity = (Net income / Average shareholder's funds)*100
=($31,500/$268,950)* 100
11.71 %
2018
Net income = $37,300
Shareholder's funds = $256,900
Return on equity = (Net income / shareholder's funds)*100
=($37,300/$256900)*100
14.52% ( Rounded off )
Now, What mistakes you did
You have solved the Return of equity for 2019 year by taking $ 281,000 as a shareholder's fund .You forgot to take the average of shareholder's funds. That's why answer 11.21% is incorrect
can someone help me with G H I and O please Financial statements for Fanning Company...
 can someone help me with
G H I and O please
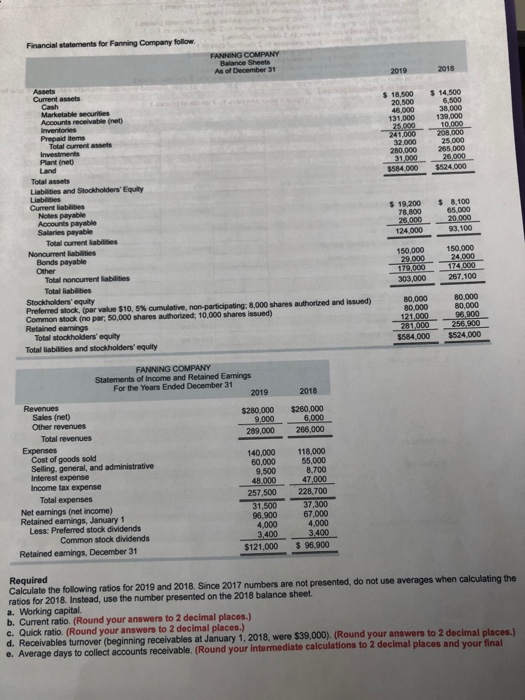
Financial statements for Fanning Company follow FANNING COMPANY Balance Sheets As of December 31 2019 2018 25.000 241,000 208.000 280,000 31,000 $584 000 26.000 $524 000 $ Current assets Cash Marketable securities Accounts receivable net) Inventories Prepaid items Total current assets Investments Plant (net) Land Total assets Liabilities and Stockholders' Equity Liabilities Current liable Notes payable Accounts payable Salaries payable Total current a s Noncurrenties Bonds payable Other Total...
can someone help me with
G H I and O please
Financial statements for Fanning Company follow FANNING COMPANY Balance Sheets As of December 31 2019 2018 25.000 241,000 208.000 280,000 31,000 $584 000 26.000 $524 000 $ Current assets Cash Marketable securities Accounts receivable net) Inventories Prepaid items Total current assets Investments Plant (net) Land Total assets Liabilities and Stockholders' Equity Liabilities Current liable Notes payable Accounts payable Salaries payable Total current a s Noncurrenties Bonds payable Other Total...
can someone help me with f g h i j k l m n o p...
 can someone help me with
f g h i j k l m n o p q r s please
Financial statements for Fanning Company follow FANNING COMPANY Balance Sheets As of December 31 2019 2018 25.000 241,000 208.000 280,000 31,000 $584 000 26.000 $524 000 $ Current assets Cash Marketable securities Accounts receivable net) Inventories Prepaid items Total current assets Investments Plant (net) Land Total assets Liabilities and Stockholders' Equity Liabilities Current liable Notes payable Accounts payable Salaries payable...
can someone help me with
f g h i j k l m n o p q r s please
Financial statements for Fanning Company follow FANNING COMPANY Balance Sheets As of December 31 2019 2018 25.000 241,000 208.000 280,000 31,000 $584 000 26.000 $524 000 $ Current assets Cash Marketable securities Accounts receivable net) Inventories Prepaid items Total current assets Investments Plant (net) Land Total assets Liabilities and Stockholders' Equity Liabilities Current liable Notes payable Accounts payable Salaries payable...
hello , can someone help me with the question J P Q R and S Financial...
 hello , can someone help me with the question
J P Q R and S
Financial statements for Fanning Company follow FANNING COMPANY Balance Sheets As of December 31 2019 2018 25.000 241,000 208.000 280,000 31,000 $584 000 26.000 $524 000 $ Current assets Cash Marketable securities Accounts receivable net) Inventories Prepaid items Total current assets Investments Plant (net) Land Total assets Liabilities and Stockholders' Equity Liabilities Current liable Notes payable Accounts payable Salaries payable Total current a s Noncurrenties...
hello , can someone help me with the question
J P Q R and S
Financial statements for Fanning Company follow FANNING COMPANY Balance Sheets As of December 31 2019 2018 25.000 241,000 208.000 280,000 31,000 $584 000 26.000 $524 000 $ Current assets Cash Marketable securities Accounts receivable net) Inventories Prepaid items Total current assets Investments Plant (net) Land Total assets Liabilities and Stockholders' Equity Liabilities Current liable Notes payable Accounts payable Salaries payable Total current a s Noncurrenties...
can someone help me for the question S . the last qustion thank you Financial statements...
 can someone help me for the question S . the last
qustion
thank you
Financial statements for Fanning Company follow FANNING COMPANY Balance Sheets As of December 31 2019 2018 25.000 241,000 208.000 280,000 31,000 $584 000 26.000 $524 000 $ Current assets Cash Marketable securities Accounts receivable net) Inventories Prepaid items Total current assets Investments Plant (net) Land Total assets Liabilities and Stockholders' Equity Liabilities Current liable Notes payable Accounts payable Salaries payable Total current a s Noncurrenties Bonds...
can someone help me for the question S . the last
qustion
thank you
Financial statements for Fanning Company follow FANNING COMPANY Balance Sheets As of December 31 2019 2018 25.000 241,000 208.000 280,000 31,000 $584 000 26.000 $524 000 $ Current assets Cash Marketable securities Accounts receivable net) Inventories Prepaid items Total current assets Investments Plant (net) Land Total assets Liabilities and Stockholders' Equity Liabilities Current liable Notes payable Accounts payable Salaries payable Total current a s Noncurrenties Bonds...
can someone help me with M and N please thank you Financial statements for Fanning Company...
 can someone help me with M and N please
thank you
Financial statements for Fanning Company follow FANNING COMPANY Balance Sheets As of December 31 2019 2018 25.000 241,000 208.000 280,000 31,000 $584 000 26.000 $524 000 $ Current assets Cash Marketable securities Accounts receivable net) Inventories Prepaid items Total current assets Investments Plant (net) Land Total assets Liabilities and Stockholders' Equity Liabilities Current liable Notes payable Accounts payable Salaries payable Total current a s Noncurrenties Bonds payable Other Total...
can someone help me with M and N please
thank you
Financial statements for Fanning Company follow FANNING COMPANY Balance Sheets As of December 31 2019 2018 25.000 241,000 208.000 280,000 31,000 $584 000 26.000 $524 000 $ Current assets Cash Marketable securities Accounts receivable net) Inventories Prepaid items Total current assets Investments Plant (net) Land Total assets Liabilities and Stockholders' Equity Liabilities Current liable Notes payable Accounts payable Salaries payable Total current a s Noncurrenties Bonds payable Other Total...
can someone help me Financial statements for Fanning Company follow FANNING COMPANY Balance Sheets As of...
 can someone help me
Financial statements for Fanning Company follow FANNING COMPANY Balance Sheets As of December 31 2019 2018 25.000 241,000 208.000 280,000 31,000 $584 000 26.000 $524 000 $ Current assets Cash Marketable securities Accounts receivable net) Inventories Prepaid items Total current assets Investments Plant (net) Land Total assets Liabilities and Stockholders' Equity Liabilities Current liable Notes payable Accounts payable Salaries payable Total current a s Noncurrenties Bonds payable Other Total noncurrent abilities Total liabilities Stockholders' equity Preferred...
can someone help me
Financial statements for Fanning Company follow FANNING COMPANY Balance Sheets As of December 31 2019 2018 25.000 241,000 208.000 280,000 31,000 $584 000 26.000 $524 000 $ Current assets Cash Marketable securities Accounts receivable net) Inventories Prepaid items Total current assets Investments Plant (net) Land Total assets Liabilities and Stockholders' Equity Liabilities Current liable Notes payable Accounts payable Salaries payable Total current a s Noncurrenties Bonds payable Other Total noncurrent abilities Total liabilities Stockholders' equity Preferred...
I need help with K. through S. PLEASE! Financial statements for Solomon Company follow. SOLOMON COMPANY...
I need help with K. through S. PLEASE! Financial statements for Solomon Company follow. SOLOMON COMPANY Balance Sheets As of December 31 2019 2018 Assets Current assets Cash $ 23,000 $ 19,000 Marketable securities 21,400 7,400 Accounts receivable (net) 55,000 47,000 Inventories 140,000 148,000 Prepaid items 29,000 14,000 Total current assets 268,400 235,400 Investments 32,000 25,000 Plant (net) 280,000 265,000 Land 32,000 27,000 Total assets $ 612,400 $ 552,400 Liabilities and Stockholders’ Equity Liabilities Current liabilities Notes payable $ 35,400...
I need help with e. through s. PLEASE! Financial statements for Solomon Company follow. SOLOMON COMPANY...
I need help with e. through s. PLEASE! Financial statements for Solomon Company follow. SOLOMON COMPANY Balance Sheets As of December 31 2019 2018 Assets Current assets Cash $ 23,000 $ 19,000 Marketable securities 21,400 7,400 Accounts receivable (net) 55,000 47,000 Inventories 140,000 148,000 Prepaid items 29,000 14,000 Total current assets 268,400 235,400 Investments 32,000 25,000 Plant (net) 280,000 265,000 Land 32,000 27,000 Total assets $ 612,400 $ 552,400 Liabilities and Stockholders’ Equity Liabilities Current liabilities Notes payable $ 35,400...
Financial statements for Vernon Company follow. VERNON COMPANY Balance Sheets As of December 31 2019 2018...
 Financial statements for Vernon Company follow. VERNON COMPANY Balance Sheets As of December 31 2019 2018 $ 24,500 21,700 58,000 143,000 27,000 274,200 32,000 295,000 27,000 $628,200 $ 20,500 7,700 50,000 151,000 12,000 241,200 25,000 280,000 22,000 $568,200 Assets Current assets Cash Marketable securities Accounts receivable (net) Inventories Prepaid items Total current assets Investments Plant (net) Land Total assets Liabilities and Stockholders' Equity Liabilities Current liabilities Notes payable Accounts payable Salaries payable Total current liabilities Noncurrent liabilities Bonds payable Other...
Financial statements for Franklin Company follow. FRANKLIN COMPANY Balance Sheets As of December 31 2019 2018...
Financial statements for Franklin Company follow. FRANKLIN COMPANY Balance Sheets As of December 31 2019 2018 Assets Current assets Cash $ 19,500 $ 15,500 Marketable securities 20,700 6,700 Accounts receivable (net) 48,000 40,000 Inventories 133,000 141,000 Prepaid items 27,000 12,000 Total current assets 248,200 215,200 Investments 22,000 15,000 Plant (net) 290,000 275,000 Land 33,000 28,000 Total assets $ 593,200 $ 533,200 Liabilities and Stockholders’ Equity Liabilities Current liabilities Notes payable $ 31,200 $ 18,200 Accounts payable 133,800 120,000 Salaries payable...
 can someone help me with
G H I and O please
Financial statements for Fanning Company follow FANNING COMPANY Balance Sheets As of December 31 2019 2018 25.000 241,000 208.000 280,000 31,000 $584 000 26.000 $524 000 $ Current assets Cash Marketable securities Accounts receivable net) Inventories Prepaid items Total current assets Investments Plant (net) Land Total assets Liabilities and Stockholders' Equity Liabilities Current liable Notes payable Accounts payable Salaries payable Total current a s Noncurrenties Bonds payable Other Total...
can someone help me with
G H I and O please
Financial statements for Fanning Company follow FANNING COMPANY Balance Sheets As of December 31 2019 2018 25.000 241,000 208.000 280,000 31,000 $584 000 26.000 $524 000 $ Current assets Cash Marketable securities Accounts receivable net) Inventories Prepaid items Total current assets Investments Plant (net) Land Total assets Liabilities and Stockholders' Equity Liabilities Current liable Notes payable Accounts payable Salaries payable Total current a s Noncurrenties Bonds payable Other Total...
 can someone help me with
f g h i j k l m n o p q r s please
Financial statements for Fanning Company follow FANNING COMPANY Balance Sheets As of December 31 2019 2018 25.000 241,000 208.000 280,000 31,000 $584 000 26.000 $524 000 $ Current assets Cash Marketable securities Accounts receivable net) Inventories Prepaid items Total current assets Investments Plant (net) Land Total assets Liabilities and Stockholders' Equity Liabilities Current liable Notes payable Accounts payable Salaries payable...
can someone help me with
f g h i j k l m n o p q r s please
Financial statements for Fanning Company follow FANNING COMPANY Balance Sheets As of December 31 2019 2018 25.000 241,000 208.000 280,000 31,000 $584 000 26.000 $524 000 $ Current assets Cash Marketable securities Accounts receivable net) Inventories Prepaid items Total current assets Investments Plant (net) Land Total assets Liabilities and Stockholders' Equity Liabilities Current liable Notes payable Accounts payable Salaries payable...
 hello , can someone help me with the question
J P Q R and S
Financial statements for Fanning Company follow FANNING COMPANY Balance Sheets As of December 31 2019 2018 25.000 241,000 208.000 280,000 31,000 $584 000 26.000 $524 000 $ Current assets Cash Marketable securities Accounts receivable net) Inventories Prepaid items Total current assets Investments Plant (net) Land Total assets Liabilities and Stockholders' Equity Liabilities Current liable Notes payable Accounts payable Salaries payable Total current a s Noncurrenties...
hello , can someone help me with the question
J P Q R and S
Financial statements for Fanning Company follow FANNING COMPANY Balance Sheets As of December 31 2019 2018 25.000 241,000 208.000 280,000 31,000 $584 000 26.000 $524 000 $ Current assets Cash Marketable securities Accounts receivable net) Inventories Prepaid items Total current assets Investments Plant (net) Land Total assets Liabilities and Stockholders' Equity Liabilities Current liable Notes payable Accounts payable Salaries payable Total current a s Noncurrenties...
 can someone help me for the question S . the last
qustion
thank you
Financial statements for Fanning Company follow FANNING COMPANY Balance Sheets As of December 31 2019 2018 25.000 241,000 208.000 280,000 31,000 $584 000 26.000 $524 000 $ Current assets Cash Marketable securities Accounts receivable net) Inventories Prepaid items Total current assets Investments Plant (net) Land Total assets Liabilities and Stockholders' Equity Liabilities Current liable Notes payable Accounts payable Salaries payable Total current a s Noncurrenties Bonds...
can someone help me for the question S . the last
qustion
thank you
Financial statements for Fanning Company follow FANNING COMPANY Balance Sheets As of December 31 2019 2018 25.000 241,000 208.000 280,000 31,000 $584 000 26.000 $524 000 $ Current assets Cash Marketable securities Accounts receivable net) Inventories Prepaid items Total current assets Investments Plant (net) Land Total assets Liabilities and Stockholders' Equity Liabilities Current liable Notes payable Accounts payable Salaries payable Total current a s Noncurrenties Bonds...
 can someone help me with M and N please
thank you
Financial statements for Fanning Company follow FANNING COMPANY Balance Sheets As of December 31 2019 2018 25.000 241,000 208.000 280,000 31,000 $584 000 26.000 $524 000 $ Current assets Cash Marketable securities Accounts receivable net) Inventories Prepaid items Total current assets Investments Plant (net) Land Total assets Liabilities and Stockholders' Equity Liabilities Current liable Notes payable Accounts payable Salaries payable Total current a s Noncurrenties Bonds payable Other Total...
can someone help me with M and N please
thank you
Financial statements for Fanning Company follow FANNING COMPANY Balance Sheets As of December 31 2019 2018 25.000 241,000 208.000 280,000 31,000 $584 000 26.000 $524 000 $ Current assets Cash Marketable securities Accounts receivable net) Inventories Prepaid items Total current assets Investments Plant (net) Land Total assets Liabilities and Stockholders' Equity Liabilities Current liable Notes payable Accounts payable Salaries payable Total current a s Noncurrenties Bonds payable Other Total...
 can someone help me
Financial statements for Fanning Company follow FANNING COMPANY Balance Sheets As of December 31 2019 2018 25.000 241,000 208.000 280,000 31,000 $584 000 26.000 $524 000 $ Current assets Cash Marketable securities Accounts receivable net) Inventories Prepaid items Total current assets Investments Plant (net) Land Total assets Liabilities and Stockholders' Equity Liabilities Current liable Notes payable Accounts payable Salaries payable Total current a s Noncurrenties Bonds payable Other Total noncurrent abilities Total liabilities Stockholders' equity Preferred...
can someone help me
Financial statements for Fanning Company follow FANNING COMPANY Balance Sheets As of December 31 2019 2018 25.000 241,000 208.000 280,000 31,000 $584 000 26.000 $524 000 $ Current assets Cash Marketable securities Accounts receivable net) Inventories Prepaid items Total current assets Investments Plant (net) Land Total assets Liabilities and Stockholders' Equity Liabilities Current liable Notes payable Accounts payable Salaries payable Total current a s Noncurrenties Bonds payable Other Total noncurrent abilities Total liabilities Stockholders' equity Preferred...
 Financial statements for Vernon Company follow. VERNON COMPANY Balance Sheets As of December 31 2019 2018 $ 24,500 21,700 58,000 143,000 27,000 274,200 32,000 295,000 27,000 $628,200 $ 20,500 7,700 50,000 151,000 12,000 241,200 25,000 280,000 22,000 $568,200 Assets Current assets Cash Marketable securities Accounts receivable (net) Inventories Prepaid items Total current assets Investments Plant (net) Land Total assets Liabilities and Stockholders' Equity Liabilities Current liabilities Notes payable Accounts payable Salaries payable Total current liabilities Noncurrent liabilities Bonds payable Other...
Most questions answered within 3 hours.
-
An MNE is this kind of industry when competition in one country
is essentially independent of...
asked 3 minutes ago -
. For this set of questions, determine what
proportion of a normal distribution is located betweeneach...
asked 38 minutes ago -
A college student is employed as a door-to-door newspaper
salesman. Historical data suggests that the student...
asked 1 hour ago -
MATLAB HW 11 problem using Switch Case and Input commands
Write a script file that calculates...
asked 1 hour ago -
Considering gravitational time dilation, calculate the time that
passes in Earth’s surface while 1 hour passes...
asked 1 hour ago -
Minitab Problem: Take the Lake Hume June rainfall data and find
use the processes outlined in...
asked 2 hours ago -
X Company is trying to decide whether to continue using old
equipment to make Product A...
asked 2 hours ago -
IN PYTHON ONLY !! Program 2: Re-work
program #5 (WeeklyHours) from the previous assignment such that...
asked 3 hours ago -
The average length of time between arrivals at a turnpike
toll-booth is 26 seconds. What is...
asked 5 hours ago -
(a) A piston at 6.1 atm contains a gas that occupies a volume of
3.5 L....
asked 6 hours ago -
Please answer true or false. Words
cannot be changed or added in to make it true...
asked 6 hours ago -
An empty test tube weighs 15.923 grams. Then,
MgCl2•6H2O is added into the test tube. After...
asked 6 hours ago