
Homework Answers
a)

b)

c) 
d)
 e)
e)
 f)
f)

Add Answer to:
2. The following data were obtained in a su wine data were obtained in a study...
Use the following to answer questions 1-4. The average house hold size in a certain region...
Use the following to answer questions 1-4. The average house hold size in a certain region several years ago was 3.14. A sociologist wishes to test, at 5% level of significance, whether it is different now. Perform the test using the information collected by the sociologist; in a random sample of 75 households, the average size was 2.98 persons, with sample standard deviation 0.82 persons. 1. Set up the null and alternative hypothesis to test the researcher’s claim. a. ?0:?=2.98...
Using the information obtained from the previous study about exercise, the following data was obtained for...
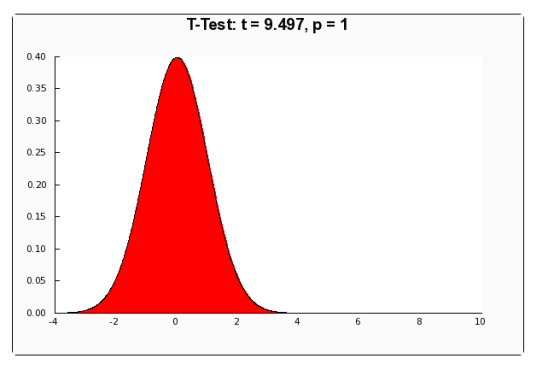
 Using the information obtained from the previous study about exercise, the following data was obtained for the hypothesis test: • Hou = 9.7. H.: # 9.7 • Assume the significance level is a = 0.10. • The z- test statistic is calculated as 3.03. What is the p-value and conclusion for this hypothesis test? Move the blue dot to choose the appropriate test(left, right, or two-tailed). Use the graph below to move the slider to the test statistic in order...
The following sample data were obtained from three populations where the variances were not equal, and...
 The following sample data were obtained from three populations where the variances were not equal, and you wish to compare the populations. Sample 1 20 26 38 45 60 70 Sample 2 13 15 23 28 31 Sample 3 39 43 46 51 55 Click here for the Excel Data File a. State the null hypothesis. HO: H1: b. Using the 0.02 level of risk, state the decision rule. (Round your answer to 3 decimal places.) Reject HO if H>...
The value obtained for the test statistic, z, in a one-mean 2-test is given. Whether the...
 The value obtained for the test statistic, z, in a one-mean 2-test is given. Whether the test is two tailed, left tailed, or right tailed is also specified. For parts (a) and (b). determine the P-value and decide whether, at the 1% significance level, the data provide sufficient evidence to reject the null hypothesis in favor of the alternative hypothesis. a. The test statistic in a two-tailed test is z= -1.42. The P-value is (Round to three cocimal places as...
In studying the responses to a multiple-choice test question, the following sample data were obtained. At...
 In studying the responses to a multiple-choice test question, the following sample data were obtained. At the 0.10 significance level, test the claim that the responses occur with the same frequency. Ho: The responses to the questions occur with the same frequency Ha: The responses to the questions do not occur with the same frequency C 2 Observed Expected | (O - E) Response Frequency |Frequency E 24 A B 6 C 6 25 D E 17 What is the...
A genetic engineering average more tomatoes than other varieties. A farmer wants to test the claim...
 A genetic engineering average more tomatoes than other varieties. A farmer wants to test the claim on a small sca company claims that it has developed modified tomato plant that full-scale planting. Ten genetically modified tomato plants are grown from seeds along At the season's end, the resulting yields in pound are recorded as below Sample 1 Sample 2 Modified Regular o test the claim on a small scale before committing to a own from seeds along with ten other...
3. Very-low-calorie diet (VLCD) Treatment Table gives B (before) and A (after) treatment data for obese...
 3. Very-low-calorie diet (VLCD) Treatment Table gives B (before) and A (after) treatment data for obese female patients in a weight-loss program Table of Weight Loss Data 86.2 Before 99.5 126.3 91.7 121.4 111.4 108.6 114.3 115.4 73.9 79 After 72.7 87.7 93.3 92.3 96.9 84.8 92.9 Weight(kg) of Obese Women Before and After 12-Week VLCD Treatment Can we conclude, at the 95 % confidence level, that the treatment is effective in causing weight reduction in these people. That is,...
Randomly selected birth records were obtained, and categorized as listed in the table to the right....
Randomly selected birth records were obtained, and categorized as listed in the table to the right. Use a 0.01 significance level to test the reasonable claim that births occur with equal frequency on the different days of the week. How might the apparent lower frequencies on Saturday and Sunday be explained? DAY SUN MON TUES WED THURS FRI SAT NUMBER OF BIRTHS 39 56 62 55 55 61 50 1. Determine the null and alternative hypotheses. Ho = H1 =...
For the given data, (a) find the test statistic, (b) find the standardized test statistic, (c)...
 For the given data, (a) find the test statistic, (b) find the standardized test statistic, (c) decide whether the standardized test statistic is in the rejection region, and (d) decide whether you should reject or fail to reject the null hypothesis. The samples are random and independent Claim: <H2, a=0.01. Sample statistics: x = 1235, n = 30, X2 = 1205, and n = 60. Population statistics: 6 = 70 and 62 = 100. (a) The test statistic for ,...
For the given data, (a) find the test statistic, (b) find the standardized test statistic, (c)...
 For the given data, (a) find the test statistic, (b) find the standardized test statistic, (c) decide whether the standardized test statistic is in the rejection region, and (d) decide whether you should reject or fail to reject the null hypothesis. The samples are random and independent , a = 0.01. Sample statistics: x = 1235, n 40, x2 = 1195, and n2 = 70. Population statistics: o1 65 and a2 120. Claim: (a) The test statistic for -H2is (b)...
 Using the information obtained from the previous study about exercise, the following data was obtained for the hypothesis test: • Hou = 9.7. H.: # 9.7 • Assume the significance level is a = 0.10. • The z- test statistic is calculated as 3.03. What is the p-value and conclusion for this hypothesis test? Move the blue dot to choose the appropriate test(left, right, or two-tailed). Use the graph below to move the slider to the test statistic in order...
 The following sample data were obtained from three populations where the variances were not equal, and you wish to compare the populations. Sample 1 20 26 38 45 60 70 Sample 2 13 15 23 28 31 Sample 3 39 43 46 51 55 Click here for the Excel Data File a. State the null hypothesis. HO: H1: b. Using the 0.02 level of risk, state the decision rule. (Round your answer to 3 decimal places.) Reject HO if H>...
 The value obtained for the test statistic, z, in a one-mean 2-test is given. Whether the test is two tailed, left tailed, or right tailed is also specified. For parts (a) and (b). determine the P-value and decide whether, at the 1% significance level, the data provide sufficient evidence to reject the null hypothesis in favor of the alternative hypothesis. a. The test statistic in a two-tailed test is z= -1.42. The P-value is (Round to three cocimal places as...
 In studying the responses to a multiple-choice test question, the following sample data were obtained. At the 0.10 significance level, test the claim that the responses occur with the same frequency. Ho: The responses to the questions occur with the same frequency Ha: The responses to the questions do not occur with the same frequency C 2 Observed Expected | (O - E) Response Frequency |Frequency E 24 A B 6 C 6 25 D E 17 What is the...
 A genetic engineering average more tomatoes than other varieties. A farmer wants to test the claim on a small sca company claims that it has developed modified tomato plant that full-scale planting. Ten genetically modified tomato plants are grown from seeds along At the season's end, the resulting yields in pound are recorded as below Sample 1 Sample 2 Modified Regular o test the claim on a small scale before committing to a own from seeds along with ten other...
 3. Very-low-calorie diet (VLCD) Treatment Table gives B (before) and A (after) treatment data for obese female patients in a weight-loss program Table of Weight Loss Data 86.2 Before 99.5 126.3 91.7 121.4 111.4 108.6 114.3 115.4 73.9 79 After 72.7 87.7 93.3 92.3 96.9 84.8 92.9 Weight(kg) of Obese Women Before and After 12-Week VLCD Treatment Can we conclude, at the 95 % confidence level, that the treatment is effective in causing weight reduction in these people. That is,...
 For the given data, (a) find the test statistic, (b) find the standardized test statistic, (c) decide whether the standardized test statistic is in the rejection region, and (d) decide whether you should reject or fail to reject the null hypothesis. The samples are random and independent Claim: <H2, a=0.01. Sample statistics: x = 1235, n = 30, X2 = 1205, and n = 60. Population statistics: 6 = 70 and 62 = 100. (a) The test statistic for ,...
 For the given data, (a) find the test statistic, (b) find the standardized test statistic, (c) decide whether the standardized test statistic is in the rejection region, and (d) decide whether you should reject or fail to reject the null hypothesis. The samples are random and independent , a = 0.01. Sample statistics: x = 1235, n 40, x2 = 1195, and n2 = 70. Population statistics: o1 65 and a2 120. Claim: (a) The test statistic for -H2is (b)...
Most questions answered within 3 hours.
-
Write a program to solve the Josephus problem, with the following
modification:
Sample Input:
./a.out n...
asked 24 minutes ago -
At the start of a CD it is spinning at a rate of 525 rpm
(revolutions...
asked 1 hour ago -
4. Without doing any calculations, predict whether the observed
∆T would increase, decrease or remain the...
asked 2 hours ago -
Based on the range, which of the following sets of scores has
the greatest variability? 3,...
asked 3 hours ago -
Ripples in a pond travel at a velocity of 3 m/s with one peak
passing a...
asked 3 hours ago -
A man stands on the roof of a building of height 13.0 mm and
throws a...
asked 3 hours ago -
The extent to which assets are financed by borrowed funds and
other liabilities is indicated by:...
asked 4 hours ago -
Explain in detail
Germany is the fifth largest economy
explain what goods and services Germany specializes...
asked 4 hours ago -
The density of platinum is 21.45 g/mL. If a cube of platinum
with a mass of...
asked 4 hours ago -
Accounts Receivable
Sales
A/R Posting
Extended Sales Invoice
Packing Slip
Compare invoice to packing slip 2...
asked 4 hours ago -
Michaella, age 23, is a full-time law student and is claimed by
her parents as a...
asked 4 hours ago -
Why are polymers not typically casted into products?
asked 5 hours ago