

Homework Answers
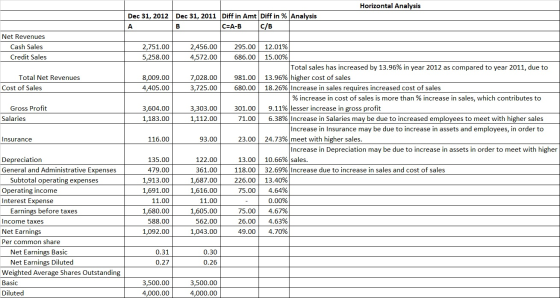
Please find attached table showing "Horizontal Analysis" of Income statement between year 2012 and year 2011:
Add Answer to:
perform a horizontal analysis of the MCL income statement (table
4-7) for 2011 and 2012. wrote...
Moderately Large Corporation Consolidaed Balance Sheet in thousands except share data) Dec. 31, 2013 Current assets:...
 Moderately Large Corporation Consolidaed Balance Sheet in thousands except share data) Dec. 31, 2013 Current assets: 1,427 876 s 1,369 Cash and cash equivalents Accounts receivable, net Inventories Prepaid expenses and other current assets Deferred income taxes, net 481 1,489 157 40 4、066 3,137 168 7,371 2,950 2,287 161 5.398 Total current assets Property, plant and equipment, net Other assets TOTAL ASSETS LIABILITIES AND SHAREHOLDERS' EQUITY Current liabilities: 242 98 Accounts payable Accrued compensation and related costs Accrued taxes Current...
SMOLIRA GOLF 2011 and 2012 Balance Sheets Liabilities and Owners' Equity 2011 Assets 2012 2012 2011...
 SMOLIRA GOLF 2011 and 2012 Balance Sheets Liabilities and Owners' Equity 2011 Assets 2012 2012 2011 Current liabilities Current assets Cash Accounts receivable Inventory $ 23,184 12,000 11,571 $ 27,420 10,800 15,553 $ 24.255 15,235 27,155 Accounts payable Notes payable Other 24,046 12.448 25.392 $ 66,645 $ 46,755 $ 53.773 S 61.886 Total Total Long-term debt Owners' equity Common stock and paid-in surplus Accumulated retained earnings $ 80,000 $95,000 $ 40,000 219,826 $ 40,000 243,606 Fixed assets Net plant and...
Do a horizontal analysis for Nike’s Income Statement for 2013 B-4 Appendix B Nike Inc., Form...
 Do a horizontal analysis for Nike’s Income Statement for
2013
B-4 Appendix B Nike Inc., Form 10-K For the Fiscal Year Ended May 31, 2013 NIKE, Inc. Consolidated Statements of Income Year Ended May 31, 2012 2013 2011 $ (In millions except per share data) Income from continuing operations: Revenues Cost of sales Gross profit Demand creation expense Operating overhead expense Total selling and administrative expense Interest (income) expense, net (Notes 6, 7 and 8) Other (income) expense, net (Note...
Do a horizontal analysis for Nike’s Income Statement for
2013
B-4 Appendix B Nike Inc., Form 10-K For the Fiscal Year Ended May 31, 2013 NIKE, Inc. Consolidated Statements of Income Year Ended May 31, 2012 2013 2011 $ (In millions except per share data) Income from continuing operations: Revenues Cost of sales Gross profit Demand creation expense Operating overhead expense Total selling and administrative expense Interest (income) expense, net (Notes 6, 7 and 8) Other (income) expense, net (Note...
Part 1: Ratio Analysis calculate the following ratios Part 2: Perform a vertical analysis of statement...
 Part 1: Ratio Analysis calculate the following ratios
Part 2: Perform a vertical analysis of statement of financial
position & Income statement
Part 3: Perform a Horizontal Analysis of statement of
Financial Position for 2015 and 2014 & Income statement for
2015
Instructions: 1. On pages three and four, you will find condensed statement of financial position and income statement data for Waterloo Corporation. 2. Use the same information to answer all the three parts. 3. Part 1: a. In...
Part 1: Ratio Analysis calculate the following ratios
Part 2: Perform a vertical analysis of statement of financial
position & Income statement
Part 3: Perform a Horizontal Analysis of statement of
Financial Position for 2015 and 2014 & Income statement for
2015
Instructions: 1. On pages three and four, you will find condensed statement of financial position and income statement data for Waterloo Corporation. 2. Use the same information to answer all the three parts. 3. Part 1: a. In...
pleass answer 13 until 19 . thank you ollows. The mar December 31, 2012 j. Paid cash for prepare P9-4 Nineteen...
 pleass answer 13 until 19 . thank you
ollows. The mar December 31, 2012 j. Paid cash for prepare P9-4 Nineteen measures of liquidity, solvency, and profitability The comparative financial statements of Tec Solutions Inc. are as follow ket price of Tec Solutions Inc, common stock was $89.75 on December TEC SOLUTIONS INC. Comparative Income Statement For the Years Ended December 31, 2012 and 2011 2012 Sales Sales returns and allowances Net sales Cost of goods sold Gross profit Selling...
pleass answer 13 until 19 . thank you
ollows. The mar December 31, 2012 j. Paid cash for prepare P9-4 Nineteen measures of liquidity, solvency, and profitability The comparative financial statements of Tec Solutions Inc. are as follow ket price of Tec Solutions Inc, common stock was $89.75 on December TEC SOLUTIONS INC. Comparative Income Statement For the Years Ended December 31, 2012 and 2011 2012 Sales Sales returns and allowances Net sales Cost of goods sold Gross profit Selling...
Prepare the statement of clash flow for the year 2012 Question 2 Based on the above...
 Prepare the statement of clash flow for the
year 2012
Question 2 Based on the above information, prepare a statement of cash flow for the year 2012. WINDOWS SDN BHD BALANCE SHEET AS OF DECEMBER 31, 2012 AND 2011 2012 2011 CURRENT ASSETS Cash Account receivable Inventory Total current assets 24.000 70,000 25,000 65.000 100,000 190,000 205,000 FIXED ASSETS Gross plant and equipment Less: Depreciation Net plant and equipment Other long term assets Totalfixed assets 365.000 51.000 315,000 50.000 365.000...
Prepare the statement of clash flow for the
year 2012
Question 2 Based on the above information, prepare a statement of cash flow for the year 2012. WINDOWS SDN BHD BALANCE SHEET AS OF DECEMBER 31, 2012 AND 2011 2012 2011 CURRENT ASSETS Cash Account receivable Inventory Total current assets 24.000 70,000 25,000 65.000 100,000 190,000 205,000 FIXED ASSETS Gross plant and equipment Less: Depreciation Net plant and equipment Other long term assets Totalfixed assets 365.000 51.000 315,000 50.000 365.000...
thunbs up if correct thanks! 2011 Based on the following financial statements: Income Statement 2012 Sales...
 thunbs up if correct thanks!
2011 Based on the following financial statements: Income Statement 2012 Sales $5,500,000 Cost of goods sold 2,850,000 Depreciation 280.000 Soling & administrative expenses 1,500,000 EBIT 870,000 Interest expense. 130,000 Taxable income 740,000 TAXOS 330,000 Not incomo $410,000 Balance Sheet, year-end 2012 Assets Cash $ 50,000 Accounts receivable 680,000 Inventory 490.000 Total current assets $1,200,000 Fixed assets 3,100,000 Total assets $4,300,000 Liabilities and shareholders' equity Accounts payable $ 340,000 Short-term dobt 480.000 Total current lotos $...
thunbs up if correct thanks!
2011 Based on the following financial statements: Income Statement 2012 Sales $5,500,000 Cost of goods sold 2,850,000 Depreciation 280.000 Soling & administrative expenses 1,500,000 EBIT 870,000 Interest expense. 130,000 Taxable income 740,000 TAXOS 330,000 Not incomo $410,000 Balance Sheet, year-end 2012 Assets Cash $ 50,000 Accounts receivable 680,000 Inventory 490.000 Total current assets $1,200,000 Fixed assets 3,100,000 Total assets $4,300,000 Liabilities and shareholders' equity Accounts payable $ 340,000 Short-term dobt 480.000 Total current lotos $...
thumbs up of correct thanks! Based on the following financial statements: Income Statement 2012 $5,500,000 2,850,000...
 thumbs up of correct thanks!
Based on the following financial statements: Income Statement 2012 $5,500,000 2,850,000 280,000 1,500,000 870,000 130,000 740,000 330,000 $ 410,000 2012 2011 Salos Cost of goods sold Depreciation Seling & administrative expenses EBIT Inforest expense Taxable income Taxes Net Income Balance Sheet, year-end Assets Cash Accounts rocovabilo Inventory Total current sets Fixed assets Total assets Liabilities and shareholders' equity Accounts payable Short-term dobt Total current liabilities Longform bonds Total abetos $ 50,000 660,000 490.000 $1,200,000 3,100,000...
thumbs up of correct thanks!
Based on the following financial statements: Income Statement 2012 $5,500,000 2,850,000 280,000 1,500,000 870,000 130,000 740,000 330,000 $ 410,000 2012 2011 Salos Cost of goods sold Depreciation Seling & administrative expenses EBIT Inforest expense Taxable income Taxes Net Income Balance Sheet, year-end Assets Cash Accounts rocovabilo Inventory Total current sets Fixed assets Total assets Liabilities and shareholders' equity Accounts payable Short-term dobt Total current liabilities Longform bonds Total abetos $ 50,000 660,000 490.000 $1,200,000 3,100,000...
2012 $ 215 310 328 $ 853 PHILIPPE CORPORATION 2011 and 2012 Balance Sheets ($ in...
 2012 $ 215 310 328 $ 853 PHILIPPE CORPORATION 2011 and 2012 Balance Sheets ($ in millions) 2011 Assets Current assets Cash $ 210 Accounts receivable 355 Inventory 507 Total $1,072 Fixed assets Net plant and equipment $6,085 Total assets $7,157 Liabilities and Owners' Equity Current liabilities Accounts payable $ 207 Notes payable 1.715 Total $1,922 Long-term debt $1,987 Owners' equity Common stock and paid-in surplus $1,000 Retained earnings 2.248 Total $3,248 Total liabilities and owners' equity $7.157 $6,527 $7,380...
Do a vertical analysis for Nike’s Income Statement for 2013 B-4 Appendix B Nike Inc., Form...
 Do a vertical analysis for Nike’s Income Statement for 2013
B-4 Appendix B Nike Inc., Form 10-K For the Fiscal Year Ended May 31, 2013 NIKE, Inc. Consolidated Statements of Income Year Ended May 31, 2012 2013 2011 $ (In millions except per share data) Income from continuing operations: Revenues Cost of sales Gross profit Demand creation expense Operating overhead expense Total selling and administrative expense Interest (income) expense, net (Notes 6, 7 and 8) Other (income) expense, net (Note...
Do a vertical analysis for Nike’s Income Statement for 2013
B-4 Appendix B Nike Inc., Form 10-K For the Fiscal Year Ended May 31, 2013 NIKE, Inc. Consolidated Statements of Income Year Ended May 31, 2012 2013 2011 $ (In millions except per share data) Income from continuing operations: Revenues Cost of sales Gross profit Demand creation expense Operating overhead expense Total selling and administrative expense Interest (income) expense, net (Notes 6, 7 and 8) Other (income) expense, net (Note...
 Moderately Large Corporation Consolidaed Balance Sheet in thousands except share data) Dec. 31, 2013 Current assets: 1,427 876 s 1,369 Cash and cash equivalents Accounts receivable, net Inventories Prepaid expenses and other current assets Deferred income taxes, net 481 1,489 157 40 4、066 3,137 168 7,371 2,950 2,287 161 5.398 Total current assets Property, plant and equipment, net Other assets TOTAL ASSETS LIABILITIES AND SHAREHOLDERS' EQUITY Current liabilities: 242 98 Accounts payable Accrued compensation and related costs Accrued taxes Current...
 SMOLIRA GOLF 2011 and 2012 Balance Sheets Liabilities and Owners' Equity 2011 Assets 2012 2012 2011 Current liabilities Current assets Cash Accounts receivable Inventory $ 23,184 12,000 11,571 $ 27,420 10,800 15,553 $ 24.255 15,235 27,155 Accounts payable Notes payable Other 24,046 12.448 25.392 $ 66,645 $ 46,755 $ 53.773 S 61.886 Total Total Long-term debt Owners' equity Common stock and paid-in surplus Accumulated retained earnings $ 80,000 $95,000 $ 40,000 219,826 $ 40,000 243,606 Fixed assets Net plant and...
 Do a horizontal analysis for Nike’s Income Statement for
2013
B-4 Appendix B Nike Inc., Form 10-K For the Fiscal Year Ended May 31, 2013 NIKE, Inc. Consolidated Statements of Income Year Ended May 31, 2012 2013 2011 $ (In millions except per share data) Income from continuing operations: Revenues Cost of sales Gross profit Demand creation expense Operating overhead expense Total selling and administrative expense Interest (income) expense, net (Notes 6, 7 and 8) Other (income) expense, net (Note...
Do a horizontal analysis for Nike’s Income Statement for
2013
B-4 Appendix B Nike Inc., Form 10-K For the Fiscal Year Ended May 31, 2013 NIKE, Inc. Consolidated Statements of Income Year Ended May 31, 2012 2013 2011 $ (In millions except per share data) Income from continuing operations: Revenues Cost of sales Gross profit Demand creation expense Operating overhead expense Total selling and administrative expense Interest (income) expense, net (Notes 6, 7 and 8) Other (income) expense, net (Note...
 Part 1: Ratio Analysis calculate the following ratios
Part 2: Perform a vertical analysis of statement of financial
position & Income statement
Part 3: Perform a Horizontal Analysis of statement of
Financial Position for 2015 and 2014 & Income statement for
2015
Instructions: 1. On pages three and four, you will find condensed statement of financial position and income statement data for Waterloo Corporation. 2. Use the same information to answer all the three parts. 3. Part 1: a. In...
Part 1: Ratio Analysis calculate the following ratios
Part 2: Perform a vertical analysis of statement of financial
position & Income statement
Part 3: Perform a Horizontal Analysis of statement of
Financial Position for 2015 and 2014 & Income statement for
2015
Instructions: 1. On pages three and four, you will find condensed statement of financial position and income statement data for Waterloo Corporation. 2. Use the same information to answer all the three parts. 3. Part 1: a. In...
 pleass answer 13 until 19 . thank you
ollows. The mar December 31, 2012 j. Paid cash for prepare P9-4 Nineteen measures of liquidity, solvency, and profitability The comparative financial statements of Tec Solutions Inc. are as follow ket price of Tec Solutions Inc, common stock was $89.75 on December TEC SOLUTIONS INC. Comparative Income Statement For the Years Ended December 31, 2012 and 2011 2012 Sales Sales returns and allowances Net sales Cost of goods sold Gross profit Selling...
pleass answer 13 until 19 . thank you
ollows. The mar December 31, 2012 j. Paid cash for prepare P9-4 Nineteen measures of liquidity, solvency, and profitability The comparative financial statements of Tec Solutions Inc. are as follow ket price of Tec Solutions Inc, common stock was $89.75 on December TEC SOLUTIONS INC. Comparative Income Statement For the Years Ended December 31, 2012 and 2011 2012 Sales Sales returns and allowances Net sales Cost of goods sold Gross profit Selling...
 Prepare the statement of clash flow for the
year 2012
Question 2 Based on the above information, prepare a statement of cash flow for the year 2012. WINDOWS SDN BHD BALANCE SHEET AS OF DECEMBER 31, 2012 AND 2011 2012 2011 CURRENT ASSETS Cash Account receivable Inventory Total current assets 24.000 70,000 25,000 65.000 100,000 190,000 205,000 FIXED ASSETS Gross plant and equipment Less: Depreciation Net plant and equipment Other long term assets Totalfixed assets 365.000 51.000 315,000 50.000 365.000...
Prepare the statement of clash flow for the
year 2012
Question 2 Based on the above information, prepare a statement of cash flow for the year 2012. WINDOWS SDN BHD BALANCE SHEET AS OF DECEMBER 31, 2012 AND 2011 2012 2011 CURRENT ASSETS Cash Account receivable Inventory Total current assets 24.000 70,000 25,000 65.000 100,000 190,000 205,000 FIXED ASSETS Gross plant and equipment Less: Depreciation Net plant and equipment Other long term assets Totalfixed assets 365.000 51.000 315,000 50.000 365.000...
 thunbs up if correct thanks!
2011 Based on the following financial statements: Income Statement 2012 Sales $5,500,000 Cost of goods sold 2,850,000 Depreciation 280.000 Soling & administrative expenses 1,500,000 EBIT 870,000 Interest expense. 130,000 Taxable income 740,000 TAXOS 330,000 Not incomo $410,000 Balance Sheet, year-end 2012 Assets Cash $ 50,000 Accounts receivable 680,000 Inventory 490.000 Total current assets $1,200,000 Fixed assets 3,100,000 Total assets $4,300,000 Liabilities and shareholders' equity Accounts payable $ 340,000 Short-term dobt 480.000 Total current lotos $...
thunbs up if correct thanks!
2011 Based on the following financial statements: Income Statement 2012 Sales $5,500,000 Cost of goods sold 2,850,000 Depreciation 280.000 Soling & administrative expenses 1,500,000 EBIT 870,000 Interest expense. 130,000 Taxable income 740,000 TAXOS 330,000 Not incomo $410,000 Balance Sheet, year-end 2012 Assets Cash $ 50,000 Accounts receivable 680,000 Inventory 490.000 Total current assets $1,200,000 Fixed assets 3,100,000 Total assets $4,300,000 Liabilities and shareholders' equity Accounts payable $ 340,000 Short-term dobt 480.000 Total current lotos $...
 thumbs up of correct thanks!
Based on the following financial statements: Income Statement 2012 $5,500,000 2,850,000 280,000 1,500,000 870,000 130,000 740,000 330,000 $ 410,000 2012 2011 Salos Cost of goods sold Depreciation Seling & administrative expenses EBIT Inforest expense Taxable income Taxes Net Income Balance Sheet, year-end Assets Cash Accounts rocovabilo Inventory Total current sets Fixed assets Total assets Liabilities and shareholders' equity Accounts payable Short-term dobt Total current liabilities Longform bonds Total abetos $ 50,000 660,000 490.000 $1,200,000 3,100,000...
thumbs up of correct thanks!
Based on the following financial statements: Income Statement 2012 $5,500,000 2,850,000 280,000 1,500,000 870,000 130,000 740,000 330,000 $ 410,000 2012 2011 Salos Cost of goods sold Depreciation Seling & administrative expenses EBIT Inforest expense Taxable income Taxes Net Income Balance Sheet, year-end Assets Cash Accounts rocovabilo Inventory Total current sets Fixed assets Total assets Liabilities and shareholders' equity Accounts payable Short-term dobt Total current liabilities Longform bonds Total abetos $ 50,000 660,000 490.000 $1,200,000 3,100,000...
 2012 $ 215 310 328 $ 853 PHILIPPE CORPORATION 2011 and 2012 Balance Sheets ($ in millions) 2011 Assets Current assets Cash $ 210 Accounts receivable 355 Inventory 507 Total $1,072 Fixed assets Net plant and equipment $6,085 Total assets $7,157 Liabilities and Owners' Equity Current liabilities Accounts payable $ 207 Notes payable 1.715 Total $1,922 Long-term debt $1,987 Owners' equity Common stock and paid-in surplus $1,000 Retained earnings 2.248 Total $3,248 Total liabilities and owners' equity $7.157 $6,527 $7,380...
 Do a vertical analysis for Nike’s Income Statement for 2013
B-4 Appendix B Nike Inc., Form 10-K For the Fiscal Year Ended May 31, 2013 NIKE, Inc. Consolidated Statements of Income Year Ended May 31, 2012 2013 2011 $ (In millions except per share data) Income from continuing operations: Revenues Cost of sales Gross profit Demand creation expense Operating overhead expense Total selling and administrative expense Interest (income) expense, net (Notes 6, 7 and 8) Other (income) expense, net (Note...
Do a vertical analysis for Nike’s Income Statement for 2013
B-4 Appendix B Nike Inc., Form 10-K For the Fiscal Year Ended May 31, 2013 NIKE, Inc. Consolidated Statements of Income Year Ended May 31, 2012 2013 2011 $ (In millions except per share data) Income from continuing operations: Revenues Cost of sales Gross profit Demand creation expense Operating overhead expense Total selling and administrative expense Interest (income) expense, net (Notes 6, 7 and 8) Other (income) expense, net (Note...
Most questions answered within 3 hours.
-
If you mixed 35.0 mLmL of 0.100 M Tris-HCl with 65.0
mLmL of 0.200 M Tris-base, what would...
asked 45 seconds ago -
11.1 In the northeast
regions of the United States and in eastern Canada, many people
heat their...
asked 5 minutes ago -
Explain traveling wave theory. Explain how the peaking of the
wave leads to action potentials and...
asked 4 minutes ago -
Which force do you think wields a stronger influence over our
ethical behavior – our personal...
asked 6 minutes ago -
What is the entropy change to the surroundings when 1 mol of ice
melts in someone's...
asked 6 minutes ago -
Are adult gamers less likely to use a gaming console (Xbox,
PlayStation, Wii, etc...) than teen...
asked 11 minutes ago -
Pt1
An electrochemical cell is set up at 25°C based on the overall
reaction represented by...
asked 13 minutes ago -
Bruin, Inc., has identified the following two mutually
exclusive projects:
Year
Cash Flow (A)
Cash...
asked 15 minutes ago -
A mutual fund salesperson has arranged to call on four people
tomorrow. Based on past experience...
asked 18 minutes ago -
The decomposition of SO2Cl2 is first order
and has a rate constant of + 2.90 x...
asked 40 minutes ago -
A solid, frictionless cylindrical reel of mass M=5.00kg and
radius R=0.55m is used to draw water...
asked 1 hour ago -
The work done by the spring's restoring force
on the free end of a spring while...
asked 35 minutes ago