Please use hand work and formulas as it helps me better understand. Thank you so much!


Homework Answers
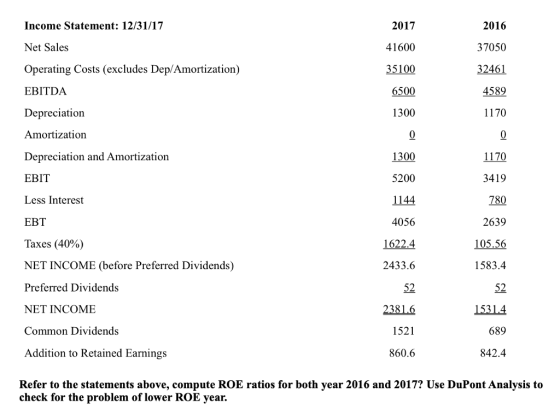
ROE = Net Income after preferred dividends/ Common Equity
For 2017
ROE = 2381.6/ (1690+9958) = 20.45%
For 2016
ROE = 1531.4/ (1690+9100)=14.19%
By DuPont analysis,
ROE= Profit margin* Asset turnover * Financial leverage
= (1531.4/ 37050 )* (37050/21840) * (21840/(1690+9100))
=4.13% * 1.7* 2.02
=14.19%
FCF in 2017 = cash from operations- Cap ex
Increase in working capital = Closing NWC _ Opening NWC
= (13000-4030) – (10530-2990)
=1430
FCF=Net Income+ Non cash expenses -Increase in working capital – Capital expense
= 2433.6 + 1300- 1430 – (13000-11310)
=613.6
Add Answer to:
Please use hand work and formulas as it helps me better
understand. Thank you so much!...
Please use hand work and formulas as I cannot use excel and it helps me better...
 Please use hand work and formulas as I cannot use excel and it
helps me better understand. Thank you!
Assets Cash and Marketable Securities Accounts Receivable Inventories Total Current Assets Net plant and equipment TOTAL ASSETS 2017 130 4875 7995 13000 13000 26000 2016 1040 4095 5395 10530 11310 21840 Liabilities and Equity Accounts Payable Notes Payable Accruals Total Current Liabilities Long Term Bonds TOTAL DEBT Preferred Stock Common Stock Retained earnings TOTAL COMMON EQUITY TOTAL LIABILITIES AND EQUITY 2017...
Please use hand work and formulas as I cannot use excel and it
helps me better understand. Thank you!
Assets Cash and Marketable Securities Accounts Receivable Inventories Total Current Assets Net plant and equipment TOTAL ASSETS 2017 130 4875 7995 13000 13000 26000 2016 1040 4095 5395 10530 11310 21840 Liabilities and Equity Accounts Payable Notes Payable Accruals Total Current Liabilities Long Term Bonds TOTAL DEBT Preferred Stock Common Stock Retained earnings TOTAL COMMON EQUITY TOTAL LIABILITIES AND EQUITY 2017...
Refer to the statement. Compute ROE for both 2017 and 2016. Use DuPont Analysis to check...
 Refer to the statement. Compute ROE for both 2017 and 2016. Use
DuPont Analysis to check for the problem of lower ROE year.
Balance Sheet: 12/31/17 Assets 2016 2017 1040 Cash and Marketable Securities 130 4095 4875 Accounts Receivable 5395 7995 Inventories 10530 13000 Total Current Assets 13000 11310 Net plant and equipment 21840 26000 TOTAL ASSETS 2016 2017 Liabilities and Equity Accounts Payable Notes Payable Accruals 520 780 780 1820 1690 1430 2990 4030 Total Current Liabilities 7540 9802...
Refer to the statement. Compute ROE for both 2017 and 2016. Use
DuPont Analysis to check for the problem of lower ROE year.
Balance Sheet: 12/31/17 Assets 2016 2017 1040 Cash and Marketable Securities 130 4095 4875 Accounts Receivable 5395 7995 Inventories 10530 13000 Total Current Assets 13000 11310 Net plant and equipment 21840 26000 TOTAL ASSETS 2016 2017 Liabilities and Equity Accounts Payable Notes Payable Accruals 520 780 780 1820 1690 1430 2990 4030 Total Current Liabilities 7540 9802...
What was the free cash flow in 2017 for FIN 300 Inc.? Please show work. Balance...
 What was the free cash flow in 2017 for FIN 300 Inc.? Please
show work.
Balance Sheet: 12/31/17 Assets Cash and Marketable Securities Accounts Receivable Inventories Total Current Assets Net plant and equipment TOTAL ASSETS 2017 130 4875 7995 13000 13000 26000 2016 1040 4095 5395 10530 11310 21840 Liabilities and Equity Accounts Payable Notes Payable Accruals Total Current Liabilities Long Term Bonds TOTAL DEBT Preferred Stock Common Stock Retained earnings TOTAL COMMON EQUITY TOTAL LIABILITIES AND EQUITY 2017 780...
What was the free cash flow in 2017 for FIN 300 Inc.? Please
show work.
Balance Sheet: 12/31/17 Assets Cash and Marketable Securities Accounts Receivable Inventories Total Current Assets Net plant and equipment TOTAL ASSETS 2017 130 4875 7995 13000 13000 26000 2016 1040 4095 5395 10530 11310 21840 Liabilities and Equity Accounts Payable Notes Payable Accruals Total Current Liabilities Long Term Bonds TOTAL DEBT Preferred Stock Common Stock Retained earnings TOTAL COMMON EQUITY TOTAL LIABILITIES AND EQUITY 2017 780...
Please, someone, help me! If you do please show working out for me to understand. Thank...
 Please, someone, help me! If you do please show working
out for me to understand. Thank you.
Measures of liquidity, Solvency, and Profitability The
comparative financial statements of Marshall Inc. are as follows.
The market price of Marshall common stock was $ 65 on December 31,
20Y2.
Marshall Inc.
Comparative Retained Earnings
Statement
For the Years Ended December 31, 20Y2 and
20Y1
20Y2
20Y1
Retained earnings, January 1
$1,262,900
$1,069,600
Net income
300,000
219,100
Total
$1,562,900
$1,288,700
Dividends:
On preferred...
Please, someone, help me! If you do please show working
out for me to understand. Thank you.
Measures of liquidity, Solvency, and Profitability The
comparative financial statements of Marshall Inc. are as follows.
The market price of Marshall common stock was $ 65 on December 31,
20Y2.
Marshall Inc.
Comparative Retained Earnings
Statement
For the Years Ended December 31, 20Y2 and
20Y1
20Y2
20Y1
Retained earnings, January 1
$1,262,900
$1,069,600
Net income
300,000
219,100
Total
$1,562,900
$1,288,700
Dividends:
On preferred...
Please show your work and explain for me so I can understand better please. 3. Restaurant...
 Please show your work and explain for me so I can understand
better please.
3. Restaurant 3313 started business with total assets of $450,000 and total liabilities of $250,000. During the year, the restaurant recorded $735,000 in revenues, $430,000 in costs and expenses, and dividends of $105,000. Answer the following questions: a. Stockholders' Equity at the beginning of the year? b. The profit for the year? c. Stockholders' Equity at the end of the year? (assuming no tax)
Please show your work and explain for me so I can understand
better please.
3. Restaurant 3313 started business with total assets of $450,000 and total liabilities of $250,000. During the year, the restaurant recorded $735,000 in revenues, $430,000 in costs and expenses, and dividends of $105,000. Answer the following questions: a. Stockholders' Equity at the beginning of the year? b. The profit for the year? c. Stockholders' Equity at the end of the year? (assuming no tax)
I need help please. I forgot the formulas for every part of the question Use the...
 I need help please.
I
forgot the formulas for every part of the question
Use the following financial statements for Lake of Egypt Marino, Inc. 2018 2017 $ 60 72 110 LAKE OF EGYPT MARINA, INC. Balance Sheet as of December 31, 2018 and 2017 (in millions of dollars) 2018 2017 Assets Liabilities and Equity Current assets: Current liabilities: Cash and marketable $ 100 $ 48 Accrued wages and taxes securities Accounts receivable 110 Accounts payable Inventory 301 174 Notes...
I need help please.
I
forgot the formulas for every part of the question
Use the following financial statements for Lake of Egypt Marino, Inc. 2018 2017 $ 60 72 110 LAKE OF EGYPT MARINA, INC. Balance Sheet as of December 31, 2018 and 2017 (in millions of dollars) 2018 2017 Assets Liabilities and Equity Current assets: Current liabilities: Cash and marketable $ 100 $ 48 Accrued wages and taxes securities Accounts receivable 110 Accounts payable Inventory 301 174 Notes...
Can you please show me how to do the following problem Exercise 17-6 Common-size percents LO...
 Can you please show me how to do the following problem
Exercise 17-6 Common-size percents LO P2 Simon Company's year-end balance sheets 2015 At December 31 Assets Cash Accounts receivable, net Merchandise inventor,y Prepaid expenses Plant assets, net Total asset:s 2017 2016 $ 24,992$ 29,797$29,523 40,168 44,075 3,280 187,254 304,300 72,433 90,160 7,807 228,194 51,634 66,204 7,745 209, 780 $ 423,586 $ 365,160 Liabilities and Equity Accounts payable Long-term notes payable secured by $ 108,637 61,095 $39,766 mortgages on plant...
Can you please show me how to do the following problem
Exercise 17-6 Common-size percents LO P2 Simon Company's year-end balance sheets 2015 At December 31 Assets Cash Accounts receivable, net Merchandise inventor,y Prepaid expenses Plant assets, net Total asset:s 2017 2016 $ 24,992$ 29,797$29,523 40,168 44,075 3,280 187,254 304,300 72,433 90,160 7,807 228,194 51,634 66,204 7,745 209, 780 $ 423,586 $ 365,160 Liabilities and Equity Accounts payable Long-term notes payable secured by $ 108,637 61,095 $39,766 mortgages on plant...
Same Table for each question. Thank you! Please use the attached balance sheet and income statements...
 Same Table for each question.
Thank you!
Please use the attached balance sheet and income statements to calculate. Cash flow from operation activity for 2019 is 2018 2019 2018 2019 Assets Liabilities & Equity Current liabilities: Current assets: Cash and marketable securities $ 10 $ 5 19 Accounts receivable $ 5 Accrued wages and taxes 20 Accounts payable 36 Notes payable Inventory - $ 53 Total $ 61 Total $ 34 S 40 Fixed assets: $ 53 $ 57 Gross...
Same Table for each question.
Thank you!
Please use the attached balance sheet and income statements to calculate. Cash flow from operation activity for 2019 is 2018 2019 2018 2019 Assets Liabilities & Equity Current liabilities: Current assets: Cash and marketable securities $ 10 $ 5 19 Accounts receivable $ 5 Accrued wages and taxes 20 Accounts payable 36 Notes payable Inventory - $ 53 Total $ 61 Total $ 34 S 40 Fixed assets: $ 53 $ 57 Gross...
Please help me answer these correctly with solutions. Thank you! Analysis and Interpretation of Profitability Balance...
 Please help me answer these correctly with solutions. Thank
you!
Analysis and Interpretation of Profitability Balance sheets and income statements for Costco Wholesale Corportation follow Consolidated Statements of Earnings September 1, September 2, August 28 For Fiscal Years Ended ($ millions) 2013 2012 2011 Revenue 97,062 $87,048 1,867 Net Sales $102,870 2,286 105,156 Membership fees 2,075 Total revenue 99,137 88,915 Operating expenses Merchandise costs Selling, general and administrative Preopening expenses 91,948 10,104 51 3,053 86,823 9,518 37 2,759 77,739 8,691...
Please help me answer these correctly with solutions. Thank
you!
Analysis and Interpretation of Profitability Balance sheets and income statements for Costco Wholesale Corportation follow Consolidated Statements of Earnings September 1, September 2, August 28 For Fiscal Years Ended ($ millions) 2013 2012 2011 Revenue 97,062 $87,048 1,867 Net Sales $102,870 2,286 105,156 Membership fees 2,075 Total revenue 99,137 88,915 Operating expenses Merchandise costs Selling, general and administrative Preopening expenses 91,948 10,104 51 3,053 86,823 9,518 37 2,759 77,739 8,691...
YOU MUST SHOW WORK ON ALL PROBLEMS TO RECEIVE CREDIT! The following questions pertain to Cline...
 YOU MUST SHOW WORK ON ALL PROBLEMS TO RECEIVE
CREDIT!
The following questions pertain to Cline Custom Bikes income
statement and balance sheet.
A. What was their depreciation expense for 2000?
B. What were the current ratios for BOTH 1999 and 2000?
C. Was their current ratio for year 2000 better or worse
compared to 1999 - a one word answer please!
D. What was their inventory turnover ratio of 2000?
E. What was the average collection period ( year...
YOU MUST SHOW WORK ON ALL PROBLEMS TO RECEIVE
CREDIT!
The following questions pertain to Cline Custom Bikes income
statement and balance sheet.
A. What was their depreciation expense for 2000?
B. What were the current ratios for BOTH 1999 and 2000?
C. Was their current ratio for year 2000 better or worse
compared to 1999 - a one word answer please!
D. What was their inventory turnover ratio of 2000?
E. What was the average collection period ( year...
 Please use hand work and formulas as I cannot use excel and it
helps me better understand. Thank you!
Assets Cash and Marketable Securities Accounts Receivable Inventories Total Current Assets Net plant and equipment TOTAL ASSETS 2017 130 4875 7995 13000 13000 26000 2016 1040 4095 5395 10530 11310 21840 Liabilities and Equity Accounts Payable Notes Payable Accruals Total Current Liabilities Long Term Bonds TOTAL DEBT Preferred Stock Common Stock Retained earnings TOTAL COMMON EQUITY TOTAL LIABILITIES AND EQUITY 2017...
Please use hand work and formulas as I cannot use excel and it
helps me better understand. Thank you!
Assets Cash and Marketable Securities Accounts Receivable Inventories Total Current Assets Net plant and equipment TOTAL ASSETS 2017 130 4875 7995 13000 13000 26000 2016 1040 4095 5395 10530 11310 21840 Liabilities and Equity Accounts Payable Notes Payable Accruals Total Current Liabilities Long Term Bonds TOTAL DEBT Preferred Stock Common Stock Retained earnings TOTAL COMMON EQUITY TOTAL LIABILITIES AND EQUITY 2017...
 Refer to the statement. Compute ROE for both 2017 and 2016. Use
DuPont Analysis to check for the problem of lower ROE year.
Balance Sheet: 12/31/17 Assets 2016 2017 1040 Cash and Marketable Securities 130 4095 4875 Accounts Receivable 5395 7995 Inventories 10530 13000 Total Current Assets 13000 11310 Net plant and equipment 21840 26000 TOTAL ASSETS 2016 2017 Liabilities and Equity Accounts Payable Notes Payable Accruals 520 780 780 1820 1690 1430 2990 4030 Total Current Liabilities 7540 9802...
Refer to the statement. Compute ROE for both 2017 and 2016. Use
DuPont Analysis to check for the problem of lower ROE year.
Balance Sheet: 12/31/17 Assets 2016 2017 1040 Cash and Marketable Securities 130 4095 4875 Accounts Receivable 5395 7995 Inventories 10530 13000 Total Current Assets 13000 11310 Net plant and equipment 21840 26000 TOTAL ASSETS 2016 2017 Liabilities and Equity Accounts Payable Notes Payable Accruals 520 780 780 1820 1690 1430 2990 4030 Total Current Liabilities 7540 9802...
 What was the free cash flow in 2017 for FIN 300 Inc.? Please
show work.
Balance Sheet: 12/31/17 Assets Cash and Marketable Securities Accounts Receivable Inventories Total Current Assets Net plant and equipment TOTAL ASSETS 2017 130 4875 7995 13000 13000 26000 2016 1040 4095 5395 10530 11310 21840 Liabilities and Equity Accounts Payable Notes Payable Accruals Total Current Liabilities Long Term Bonds TOTAL DEBT Preferred Stock Common Stock Retained earnings TOTAL COMMON EQUITY TOTAL LIABILITIES AND EQUITY 2017 780...
What was the free cash flow in 2017 for FIN 300 Inc.? Please
show work.
Balance Sheet: 12/31/17 Assets Cash and Marketable Securities Accounts Receivable Inventories Total Current Assets Net plant and equipment TOTAL ASSETS 2017 130 4875 7995 13000 13000 26000 2016 1040 4095 5395 10530 11310 21840 Liabilities and Equity Accounts Payable Notes Payable Accruals Total Current Liabilities Long Term Bonds TOTAL DEBT Preferred Stock Common Stock Retained earnings TOTAL COMMON EQUITY TOTAL LIABILITIES AND EQUITY 2017 780...
 Please, someone, help me! If you do please show working
out for me to understand. Thank you.
Measures of liquidity, Solvency, and Profitability The
comparative financial statements of Marshall Inc. are as follows.
The market price of Marshall common stock was $ 65 on December 31,
20Y2.
Marshall Inc.
Comparative Retained Earnings
Statement
For the Years Ended December 31, 20Y2 and
20Y1
20Y2
20Y1
Retained earnings, January 1
$1,262,900
$1,069,600
Net income
300,000
219,100
Total
$1,562,900
$1,288,700
Dividends:
On preferred...
Please, someone, help me! If you do please show working
out for me to understand. Thank you.
Measures of liquidity, Solvency, and Profitability The
comparative financial statements of Marshall Inc. are as follows.
The market price of Marshall common stock was $ 65 on December 31,
20Y2.
Marshall Inc.
Comparative Retained Earnings
Statement
For the Years Ended December 31, 20Y2 and
20Y1
20Y2
20Y1
Retained earnings, January 1
$1,262,900
$1,069,600
Net income
300,000
219,100
Total
$1,562,900
$1,288,700
Dividends:
On preferred...
 Please show your work and explain for me so I can understand
better please.
3. Restaurant 3313 started business with total assets of $450,000 and total liabilities of $250,000. During the year, the restaurant recorded $735,000 in revenues, $430,000 in costs and expenses, and dividends of $105,000. Answer the following questions: a. Stockholders' Equity at the beginning of the year? b. The profit for the year? c. Stockholders' Equity at the end of the year? (assuming no tax)
Please show your work and explain for me so I can understand
better please.
3. Restaurant 3313 started business with total assets of $450,000 and total liabilities of $250,000. During the year, the restaurant recorded $735,000 in revenues, $430,000 in costs and expenses, and dividends of $105,000. Answer the following questions: a. Stockholders' Equity at the beginning of the year? b. The profit for the year? c. Stockholders' Equity at the end of the year? (assuming no tax)
 I need help please.
I
forgot the formulas for every part of the question
Use the following financial statements for Lake of Egypt Marino, Inc. 2018 2017 $ 60 72 110 LAKE OF EGYPT MARINA, INC. Balance Sheet as of December 31, 2018 and 2017 (in millions of dollars) 2018 2017 Assets Liabilities and Equity Current assets: Current liabilities: Cash and marketable $ 100 $ 48 Accrued wages and taxes securities Accounts receivable 110 Accounts payable Inventory 301 174 Notes...
I need help please.
I
forgot the formulas for every part of the question
Use the following financial statements for Lake of Egypt Marino, Inc. 2018 2017 $ 60 72 110 LAKE OF EGYPT MARINA, INC. Balance Sheet as of December 31, 2018 and 2017 (in millions of dollars) 2018 2017 Assets Liabilities and Equity Current assets: Current liabilities: Cash and marketable $ 100 $ 48 Accrued wages and taxes securities Accounts receivable 110 Accounts payable Inventory 301 174 Notes...
 Can you please show me how to do the following problem
Exercise 17-6 Common-size percents LO P2 Simon Company's year-end balance sheets 2015 At December 31 Assets Cash Accounts receivable, net Merchandise inventor,y Prepaid expenses Plant assets, net Total asset:s 2017 2016 $ 24,992$ 29,797$29,523 40,168 44,075 3,280 187,254 304,300 72,433 90,160 7,807 228,194 51,634 66,204 7,745 209, 780 $ 423,586 $ 365,160 Liabilities and Equity Accounts payable Long-term notes payable secured by $ 108,637 61,095 $39,766 mortgages on plant...
Can you please show me how to do the following problem
Exercise 17-6 Common-size percents LO P2 Simon Company's year-end balance sheets 2015 At December 31 Assets Cash Accounts receivable, net Merchandise inventor,y Prepaid expenses Plant assets, net Total asset:s 2017 2016 $ 24,992$ 29,797$29,523 40,168 44,075 3,280 187,254 304,300 72,433 90,160 7,807 228,194 51,634 66,204 7,745 209, 780 $ 423,586 $ 365,160 Liabilities and Equity Accounts payable Long-term notes payable secured by $ 108,637 61,095 $39,766 mortgages on plant...
 Same Table for each question.
Thank you!
Please use the attached balance sheet and income statements to calculate. Cash flow from operation activity for 2019 is 2018 2019 2018 2019 Assets Liabilities & Equity Current liabilities: Current assets: Cash and marketable securities $ 10 $ 5 19 Accounts receivable $ 5 Accrued wages and taxes 20 Accounts payable 36 Notes payable Inventory - $ 53 Total $ 61 Total $ 34 S 40 Fixed assets: $ 53 $ 57 Gross...
Same Table for each question.
Thank you!
Please use the attached balance sheet and income statements to calculate. Cash flow from operation activity for 2019 is 2018 2019 2018 2019 Assets Liabilities & Equity Current liabilities: Current assets: Cash and marketable securities $ 10 $ 5 19 Accounts receivable $ 5 Accrued wages and taxes 20 Accounts payable 36 Notes payable Inventory - $ 53 Total $ 61 Total $ 34 S 40 Fixed assets: $ 53 $ 57 Gross...
 Please help me answer these correctly with solutions. Thank
you!
Analysis and Interpretation of Profitability Balance sheets and income statements for Costco Wholesale Corportation follow Consolidated Statements of Earnings September 1, September 2, August 28 For Fiscal Years Ended ($ millions) 2013 2012 2011 Revenue 97,062 $87,048 1,867 Net Sales $102,870 2,286 105,156 Membership fees 2,075 Total revenue 99,137 88,915 Operating expenses Merchandise costs Selling, general and administrative Preopening expenses 91,948 10,104 51 3,053 86,823 9,518 37 2,759 77,739 8,691...
Please help me answer these correctly with solutions. Thank
you!
Analysis and Interpretation of Profitability Balance sheets and income statements for Costco Wholesale Corportation follow Consolidated Statements of Earnings September 1, September 2, August 28 For Fiscal Years Ended ($ millions) 2013 2012 2011 Revenue 97,062 $87,048 1,867 Net Sales $102,870 2,286 105,156 Membership fees 2,075 Total revenue 99,137 88,915 Operating expenses Merchandise costs Selling, general and administrative Preopening expenses 91,948 10,104 51 3,053 86,823 9,518 37 2,759 77,739 8,691...
 YOU MUST SHOW WORK ON ALL PROBLEMS TO RECEIVE
CREDIT!
The following questions pertain to Cline Custom Bikes income
statement and balance sheet.
A. What was their depreciation expense for 2000?
B. What were the current ratios for BOTH 1999 and 2000?
C. Was their current ratio for year 2000 better or worse
compared to 1999 - a one word answer please!
D. What was their inventory turnover ratio of 2000?
E. What was the average collection period ( year...
YOU MUST SHOW WORK ON ALL PROBLEMS TO RECEIVE
CREDIT!
The following questions pertain to Cline Custom Bikes income
statement and balance sheet.
A. What was their depreciation expense for 2000?
B. What were the current ratios for BOTH 1999 and 2000?
C. Was their current ratio for year 2000 better or worse
compared to 1999 - a one word answer please!
D. What was their inventory turnover ratio of 2000?
E. What was the average collection period ( year...
Most questions answered within 3 hours.
-
Please answer true or false. Words
cannot be changed or added in to make it true...
asked 52 minutes ago -
An empty test tube weighs 15.923 grams. Then,
MgCl2•6H2O is added into the test tube. After...
asked 54 minutes ago -
(a) A piston at 6.1 atm contains a gas that occupies a volume of
3.5 L....
asked 53 minutes ago -
Assume memory access is 10 units of time and disk access is
10000 units of time....
asked 1 hour ago -
1. Are all good samples random?
2. Magazines often report surveys giving statistics such as “63%...
asked 1 hour ago -
Under all the various types of market structures, firms
must eventually earn some economic profits for...
asked 1 hour ago -
Consider the following fitness regime for a single locus trait
with two co-dominant alleles: w11 =...
asked 1 hour ago -
A large cable company reports the following.
80% of its customers subscribe to its cable TV...
asked 1 hour ago -
Please answer the question in brief.
Discuss the role of ERP in organizations. Are ERP tools...
asked 1 hour ago -
Discuss the pros and cons of collaborative software such
as SameTime. Does it increase productivity? What...
asked 1 hour ago -
Buying your in-laws a gift because it’s expected is
due to the ____________ motive of gift-giving....
asked 1 hour ago -
Calculate the expected value, the variance, and the standard
deviation of the given random variable X....
asked 2 hours ago