Please use hand work and formulas as I cannot use excel and it helps me better understand. Thank you!


Homework Answers
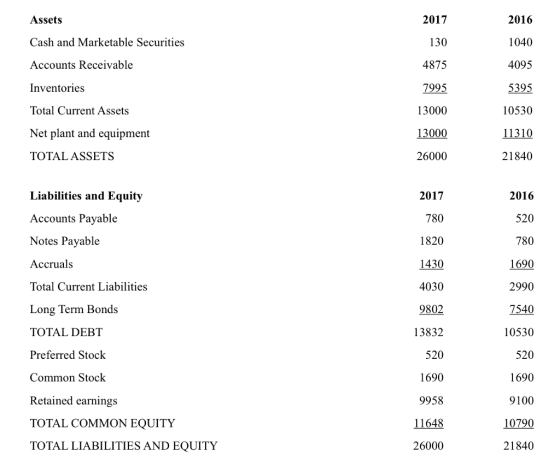
ROE = (Net profit / Total equity) * 100
ROE for 2016 = (1531.4 / 10790) * 100
ROE for 2016 = 14.19%
ROE for 2017 = (2381.60 / 11648) * 100
ROE for 2017 = 20.45%
DU POINT ANALYSIS FOR 2016:
Return on Equity= Net Profit Margin x Asset Turnover Ratio x Financial Leverage
ROE = (1531.40 / 37050) * (37050 / 21840) * (21840 / 10790)
ROE = .0413 * 1.69 * 2.02
ROE = 14.1%
In 2016, ROE was lower while in 2017, it increased. It came down in 2016 due to Net profit margin. Net Income is much lower in 2016 while it increased significantly in 2017.
Add Answer to:
Please use hand work and formulas as I cannot use excel and it
helps me better...
Please use hand work and formulas as it helps me better understand. Thank you so much!...
 Please use hand work and formulas as it helps me better
understand. Thank you so much!
Assets Cash and Marketable Securities Accounts Receivable Inventories Total Current Assets Net plant and equipment TOTAL ASSETS 2017 130 4875 7995 13000 13000 26000 2016 1040 4095 5395 10530 11310 21840 Liabilities and Equity Accounts Payable Notes Payable Accruals Total Current Liabilities Long Term Bonds TOTAL DEBT Preferred Stock Common Stock Retained earnings TOTAL COMMON EQUITY TOTAL LIABILITIES AND EQUITY 2017 780 1820 1430...
Please use hand work and formulas as it helps me better
understand. Thank you so much!
Assets Cash and Marketable Securities Accounts Receivable Inventories Total Current Assets Net plant and equipment TOTAL ASSETS 2017 130 4875 7995 13000 13000 26000 2016 1040 4095 5395 10530 11310 21840 Liabilities and Equity Accounts Payable Notes Payable Accruals Total Current Liabilities Long Term Bonds TOTAL DEBT Preferred Stock Common Stock Retained earnings TOTAL COMMON EQUITY TOTAL LIABILITIES AND EQUITY 2017 780 1820 1430...
Refer to the statement. Compute ROE for both 2017 and 2016. Use DuPont Analysis to check...
 Refer to the statement. Compute ROE for both 2017 and 2016. Use
DuPont Analysis to check for the problem of lower ROE year.
Balance Sheet: 12/31/17 Assets 2016 2017 1040 Cash and Marketable Securities 130 4095 4875 Accounts Receivable 5395 7995 Inventories 10530 13000 Total Current Assets 13000 11310 Net plant and equipment 21840 26000 TOTAL ASSETS 2016 2017 Liabilities and Equity Accounts Payable Notes Payable Accruals 520 780 780 1820 1690 1430 2990 4030 Total Current Liabilities 7540 9802...
Refer to the statement. Compute ROE for both 2017 and 2016. Use
DuPont Analysis to check for the problem of lower ROE year.
Balance Sheet: 12/31/17 Assets 2016 2017 1040 Cash and Marketable Securities 130 4095 4875 Accounts Receivable 5395 7995 Inventories 10530 13000 Total Current Assets 13000 11310 Net plant and equipment 21840 26000 TOTAL ASSETS 2016 2017 Liabilities and Equity Accounts Payable Notes Payable Accruals 520 780 780 1820 1690 1430 2990 4030 Total Current Liabilities 7540 9802...
What was the free cash flow in 2017 for FIN 300 Inc.? Please show work. Balance...
 What was the free cash flow in 2017 for FIN 300 Inc.? Please
show work.
Balance Sheet: 12/31/17 Assets Cash and Marketable Securities Accounts Receivable Inventories Total Current Assets Net plant and equipment TOTAL ASSETS 2017 130 4875 7995 13000 13000 26000 2016 1040 4095 5395 10530 11310 21840 Liabilities and Equity Accounts Payable Notes Payable Accruals Total Current Liabilities Long Term Bonds TOTAL DEBT Preferred Stock Common Stock Retained earnings TOTAL COMMON EQUITY TOTAL LIABILITIES AND EQUITY 2017 780...
What was the free cash flow in 2017 for FIN 300 Inc.? Please
show work.
Balance Sheet: 12/31/17 Assets Cash and Marketable Securities Accounts Receivable Inventories Total Current Assets Net plant and equipment TOTAL ASSETS 2017 130 4875 7995 13000 13000 26000 2016 1040 4095 5395 10530 11310 21840 Liabilities and Equity Accounts Payable Notes Payable Accruals Total Current Liabilities Long Term Bonds TOTAL DEBT Preferred Stock Common Stock Retained earnings TOTAL COMMON EQUITY TOTAL LIABILITIES AND EQUITY 2017 780...
what was the free cash flow in 2017 for FIN300.01 Inc? 2016 10 Problem 1: Below...
 what was the free cash flow in 2017 for FIN300.01 Inc?
2016 10 Problem 1: Below are financial statements of FIN300.01 Inc.. Balance Sheet: 12/31/17 Assets 2017 Cash and Marketable Securities Accounts Receivable 375 Inventories 615 Total Current Assets 1,000 Net plant and equipment 1,000 TOTAL ASSETS 2,000 315 415 810 870 1,680 2017 60 140 110 310 754 1,064 2016 40 60 130 Liabilities and Equity Accounts Payable Notes Payable Accruals Total Current Liabilities Long Term Bonds TOTAL DEBT...
what was the free cash flow in 2017 for FIN300.01 Inc?
2016 10 Problem 1: Below are financial statements of FIN300.01 Inc.. Balance Sheet: 12/31/17 Assets 2017 Cash and Marketable Securities Accounts Receivable 375 Inventories 615 Total Current Assets 1,000 Net plant and equipment 1,000 TOTAL ASSETS 2,000 315 415 810 870 1,680 2017 60 140 110 310 754 1,064 2016 40 60 130 Liabilities and Equity Accounts Payable Notes Payable Accruals Total Current Liabilities Long Term Bonds TOTAL DEBT...
What was the free cash flow in 2017 for FIN300.01 Inc.? 2016 80 Problem 1: Below...
 What was the free cash flow in 2017 for FIN300.01 Inc.?
2016 80 Problem 1: Below are financial statements of FIN300.01 Inc.: Balance Sheet: 12/31/17 Assets 2017 Cash and Marketable Securities 10 Accounts Receivable 375 Inventories 615 Total Current Assets 1,000 Net plant and equipment 1.000 TOTAL ASSETS 2,000 315 415 810 870 1,680 2017 2016 40 60 60 580 Liabilities and Equity Accounts Payable Notes Payable Accruals Total Current Liabilities Long Term Bonds TOTAL DEBT Preferred Stock Common Stock...
What was the free cash flow in 2017 for FIN300.01 Inc.?
2016 80 Problem 1: Below are financial statements of FIN300.01 Inc.: Balance Sheet: 12/31/17 Assets 2017 Cash and Marketable Securities 10 Accounts Receivable 375 Inventories 615 Total Current Assets 1,000 Net plant and equipment 1.000 TOTAL ASSETS 2,000 315 415 810 870 1,680 2017 2016 40 60 60 580 Liabilities and Equity Accounts Payable Notes Payable Accruals Total Current Liabilities Long Term Bonds TOTAL DEBT Preferred Stock Common Stock...
Please use hand work and formulas, as I cannot use excel and it helps me better...
Please use hand work and formulas, as I cannot use excel and it helps me better understand. Problem 1 What are the present value and future value of $50 to be received at the BEGINNING of each year for the next 5 years if the discount/compounding is 11%?
Problem 1: Below are financial statements of FIN300.01 Inc: Balance Sheet: 12/31/17 Assets Cash and Marketable...
 Problem 1: Below are financial statements of FIN300.01 Inc: Balance Sheet: 12/31/17 Assets Cash and Marketable Securitics Accounts Reccivable Inventorics Total Current Asscts Net plant and equipment TOTAL ASSETS 2017 10 375 61.5 1,000 2016 80 31. 41.5 810 Liabilities and Equity Accounts Payable Notes Payable Accruals Total Current Liabilities Long Term Bonds TOTAL DEBT Preferred Stock Common Stock Retained carnings TOTAL COMMON EQUITY TOTAL LIABILITIES AND EQUITY 2017 140 110 310 2016 40 G0 130 230 1,064 40 130...
Please use formulas and hand-work, it helps me better understand as I cannot use excel Problem...
 Please use formulas and hand-work, it helps me better understand
as I cannot use excel
Problem 2 What are the present value and future value of S900 to be received at the END of each year for the next 5 years if the discount/compounding is 7%?
Please use formulas and hand-work, it helps me better understand
as I cannot use excel
Problem 2 What are the present value and future value of S900 to be received at the END of each year for the next 5 years if the discount/compounding is 7%?
I need help please. I forgot the formulas for every part of the question Use the...
 I need help please.
I
forgot the formulas for every part of the question
Use the following financial statements for Lake of Egypt Marino, Inc. 2018 2017 $ 60 72 110 LAKE OF EGYPT MARINA, INC. Balance Sheet as of December 31, 2018 and 2017 (in millions of dollars) 2018 2017 Assets Liabilities and Equity Current assets: Current liabilities: Cash and marketable $ 100 $ 48 Accrued wages and taxes securities Accounts receivable 110 Accounts payable Inventory 301 174 Notes...
I need help please.
I
forgot the formulas for every part of the question
Use the following financial statements for Lake of Egypt Marino, Inc. 2018 2017 $ 60 72 110 LAKE OF EGYPT MARINA, INC. Balance Sheet as of December 31, 2018 and 2017 (in millions of dollars) 2018 2017 Assets Liabilities and Equity Current assets: Current liabilities: Cash and marketable $ 100 $ 48 Accrued wages and taxes securities Accounts receivable 110 Accounts payable Inventory 301 174 Notes...
please show all work in Excel CHAPTER 3: FINANCIAL STATEMENT ANALYSIS TOOLS NOTE: PLEASE USE WORKSHEET...
 please show all work in Excel
CHAPTER 3: FINANCIAL STATEMENT ANALYSIS TOOLS NOTE: PLEASE USE WORKSHEET #3 IN THE ATTACHED EXCEL FILE TITLED "Homework for Chapter 3_Excel TO SOLVE THE FOLLOWING PROBLEM. Homework for Chapter 3: Problem #1 in the text (Chapter 3) Sweet Dreams Corp. Balance Sheet As of Dec. 31 2017 Assets 2017 2016 Cash 431.000 339,000 Accounts Receivable 503.000 365,000 Inventories 289,000 300,000 Total Current Assets 1.223.000 1.004.000 Sweet Dreams Corp. Income Statement For the Year Ended...
please show all work in Excel
CHAPTER 3: FINANCIAL STATEMENT ANALYSIS TOOLS NOTE: PLEASE USE WORKSHEET #3 IN THE ATTACHED EXCEL FILE TITLED "Homework for Chapter 3_Excel TO SOLVE THE FOLLOWING PROBLEM. Homework for Chapter 3: Problem #1 in the text (Chapter 3) Sweet Dreams Corp. Balance Sheet As of Dec. 31 2017 Assets 2017 2016 Cash 431.000 339,000 Accounts Receivable 503.000 365,000 Inventories 289,000 300,000 Total Current Assets 1.223.000 1.004.000 Sweet Dreams Corp. Income Statement For the Year Ended...
 Please use hand work and formulas as it helps me better
understand. Thank you so much!
Assets Cash and Marketable Securities Accounts Receivable Inventories Total Current Assets Net plant and equipment TOTAL ASSETS 2017 130 4875 7995 13000 13000 26000 2016 1040 4095 5395 10530 11310 21840 Liabilities and Equity Accounts Payable Notes Payable Accruals Total Current Liabilities Long Term Bonds TOTAL DEBT Preferred Stock Common Stock Retained earnings TOTAL COMMON EQUITY TOTAL LIABILITIES AND EQUITY 2017 780 1820 1430...
Please use hand work and formulas as it helps me better
understand. Thank you so much!
Assets Cash and Marketable Securities Accounts Receivable Inventories Total Current Assets Net plant and equipment TOTAL ASSETS 2017 130 4875 7995 13000 13000 26000 2016 1040 4095 5395 10530 11310 21840 Liabilities and Equity Accounts Payable Notes Payable Accruals Total Current Liabilities Long Term Bonds TOTAL DEBT Preferred Stock Common Stock Retained earnings TOTAL COMMON EQUITY TOTAL LIABILITIES AND EQUITY 2017 780 1820 1430...
 Refer to the statement. Compute ROE for both 2017 and 2016. Use
DuPont Analysis to check for the problem of lower ROE year.
Balance Sheet: 12/31/17 Assets 2016 2017 1040 Cash and Marketable Securities 130 4095 4875 Accounts Receivable 5395 7995 Inventories 10530 13000 Total Current Assets 13000 11310 Net plant and equipment 21840 26000 TOTAL ASSETS 2016 2017 Liabilities and Equity Accounts Payable Notes Payable Accruals 520 780 780 1820 1690 1430 2990 4030 Total Current Liabilities 7540 9802...
Refer to the statement. Compute ROE for both 2017 and 2016. Use
DuPont Analysis to check for the problem of lower ROE year.
Balance Sheet: 12/31/17 Assets 2016 2017 1040 Cash and Marketable Securities 130 4095 4875 Accounts Receivable 5395 7995 Inventories 10530 13000 Total Current Assets 13000 11310 Net plant and equipment 21840 26000 TOTAL ASSETS 2016 2017 Liabilities and Equity Accounts Payable Notes Payable Accruals 520 780 780 1820 1690 1430 2990 4030 Total Current Liabilities 7540 9802...
 What was the free cash flow in 2017 for FIN 300 Inc.? Please
show work.
Balance Sheet: 12/31/17 Assets Cash and Marketable Securities Accounts Receivable Inventories Total Current Assets Net plant and equipment TOTAL ASSETS 2017 130 4875 7995 13000 13000 26000 2016 1040 4095 5395 10530 11310 21840 Liabilities and Equity Accounts Payable Notes Payable Accruals Total Current Liabilities Long Term Bonds TOTAL DEBT Preferred Stock Common Stock Retained earnings TOTAL COMMON EQUITY TOTAL LIABILITIES AND EQUITY 2017 780...
What was the free cash flow in 2017 for FIN 300 Inc.? Please
show work.
Balance Sheet: 12/31/17 Assets Cash and Marketable Securities Accounts Receivable Inventories Total Current Assets Net plant and equipment TOTAL ASSETS 2017 130 4875 7995 13000 13000 26000 2016 1040 4095 5395 10530 11310 21840 Liabilities and Equity Accounts Payable Notes Payable Accruals Total Current Liabilities Long Term Bonds TOTAL DEBT Preferred Stock Common Stock Retained earnings TOTAL COMMON EQUITY TOTAL LIABILITIES AND EQUITY 2017 780...
 what was the free cash flow in 2017 for FIN300.01 Inc?
2016 10 Problem 1: Below are financial statements of FIN300.01 Inc.. Balance Sheet: 12/31/17 Assets 2017 Cash and Marketable Securities Accounts Receivable 375 Inventories 615 Total Current Assets 1,000 Net plant and equipment 1,000 TOTAL ASSETS 2,000 315 415 810 870 1,680 2017 60 140 110 310 754 1,064 2016 40 60 130 Liabilities and Equity Accounts Payable Notes Payable Accruals Total Current Liabilities Long Term Bonds TOTAL DEBT...
what was the free cash flow in 2017 for FIN300.01 Inc?
2016 10 Problem 1: Below are financial statements of FIN300.01 Inc.. Balance Sheet: 12/31/17 Assets 2017 Cash and Marketable Securities Accounts Receivable 375 Inventories 615 Total Current Assets 1,000 Net plant and equipment 1,000 TOTAL ASSETS 2,000 315 415 810 870 1,680 2017 60 140 110 310 754 1,064 2016 40 60 130 Liabilities and Equity Accounts Payable Notes Payable Accruals Total Current Liabilities Long Term Bonds TOTAL DEBT...
 What was the free cash flow in 2017 for FIN300.01 Inc.?
2016 80 Problem 1: Below are financial statements of FIN300.01 Inc.: Balance Sheet: 12/31/17 Assets 2017 Cash and Marketable Securities 10 Accounts Receivable 375 Inventories 615 Total Current Assets 1,000 Net plant and equipment 1.000 TOTAL ASSETS 2,000 315 415 810 870 1,680 2017 2016 40 60 60 580 Liabilities and Equity Accounts Payable Notes Payable Accruals Total Current Liabilities Long Term Bonds TOTAL DEBT Preferred Stock Common Stock...
What was the free cash flow in 2017 for FIN300.01 Inc.?
2016 80 Problem 1: Below are financial statements of FIN300.01 Inc.: Balance Sheet: 12/31/17 Assets 2017 Cash and Marketable Securities 10 Accounts Receivable 375 Inventories 615 Total Current Assets 1,000 Net plant and equipment 1.000 TOTAL ASSETS 2,000 315 415 810 870 1,680 2017 2016 40 60 60 580 Liabilities and Equity Accounts Payable Notes Payable Accruals Total Current Liabilities Long Term Bonds TOTAL DEBT Preferred Stock Common Stock...
 Problem 1: Below are financial statements of FIN300.01 Inc: Balance Sheet: 12/31/17 Assets Cash and Marketable Securitics Accounts Reccivable Inventorics Total Current Asscts Net plant and equipment TOTAL ASSETS 2017 10 375 61.5 1,000 2016 80 31. 41.5 810 Liabilities and Equity Accounts Payable Notes Payable Accruals Total Current Liabilities Long Term Bonds TOTAL DEBT Preferred Stock Common Stock Retained carnings TOTAL COMMON EQUITY TOTAL LIABILITIES AND EQUITY 2017 140 110 310 2016 40 G0 130 230 1,064 40 130...
 Please use formulas and hand-work, it helps me better understand
as I cannot use excel
Problem 2 What are the present value and future value of S900 to be received at the END of each year for the next 5 years if the discount/compounding is 7%?
Please use formulas and hand-work, it helps me better understand
as I cannot use excel
Problem 2 What are the present value and future value of S900 to be received at the END of each year for the next 5 years if the discount/compounding is 7%?
 I need help please.
I
forgot the formulas for every part of the question
Use the following financial statements for Lake of Egypt Marino, Inc. 2018 2017 $ 60 72 110 LAKE OF EGYPT MARINA, INC. Balance Sheet as of December 31, 2018 and 2017 (in millions of dollars) 2018 2017 Assets Liabilities and Equity Current assets: Current liabilities: Cash and marketable $ 100 $ 48 Accrued wages and taxes securities Accounts receivable 110 Accounts payable Inventory 301 174 Notes...
I need help please.
I
forgot the formulas for every part of the question
Use the following financial statements for Lake of Egypt Marino, Inc. 2018 2017 $ 60 72 110 LAKE OF EGYPT MARINA, INC. Balance Sheet as of December 31, 2018 and 2017 (in millions of dollars) 2018 2017 Assets Liabilities and Equity Current assets: Current liabilities: Cash and marketable $ 100 $ 48 Accrued wages and taxes securities Accounts receivable 110 Accounts payable Inventory 301 174 Notes...
 please show all work in Excel
CHAPTER 3: FINANCIAL STATEMENT ANALYSIS TOOLS NOTE: PLEASE USE WORKSHEET #3 IN THE ATTACHED EXCEL FILE TITLED "Homework for Chapter 3_Excel TO SOLVE THE FOLLOWING PROBLEM. Homework for Chapter 3: Problem #1 in the text (Chapter 3) Sweet Dreams Corp. Balance Sheet As of Dec. 31 2017 Assets 2017 2016 Cash 431.000 339,000 Accounts Receivable 503.000 365,000 Inventories 289,000 300,000 Total Current Assets 1.223.000 1.004.000 Sweet Dreams Corp. Income Statement For the Year Ended...
please show all work in Excel
CHAPTER 3: FINANCIAL STATEMENT ANALYSIS TOOLS NOTE: PLEASE USE WORKSHEET #3 IN THE ATTACHED EXCEL FILE TITLED "Homework for Chapter 3_Excel TO SOLVE THE FOLLOWING PROBLEM. Homework for Chapter 3: Problem #1 in the text (Chapter 3) Sweet Dreams Corp. Balance Sheet As of Dec. 31 2017 Assets 2017 2016 Cash 431.000 339,000 Accounts Receivable 503.000 365,000 Inventories 289,000 300,000 Total Current Assets 1.223.000 1.004.000 Sweet Dreams Corp. Income Statement For the Year Ended...
Most questions answered within 3 hours.
-
Discuss the pros and cons of collaborative software such
as SameTime. Does it increase productivity? What...
asked 10 minutes ago -
1. Are all good samples random?
2. Magazines often report surveys giving statistics such as “63%...
asked 5 minutes ago -
Buying your in-laws a gift because it’s expected is
due to the ____________ motive of gift-giving....
asked 13 minutes ago -
A large cable company reports the following.
80% of its customers subscribe to its cable TV...
asked 12 minutes ago -
Calculate the expected value, the variance, and the standard
deviation of the given random variable X....
asked 56 minutes ago -
A hospital performs 100 surgeries per week. The probability that
complications after surgery occur is 10%....
asked 1 hour ago -
1 point) Given the significance level α=0.01 find the following:
(a) left-tailed z value z= (b)...
asked 54 minutes ago -
Assuming you are the head of the software development unit at
Cyber.Soft, explain and justify why...
asked 20 minutes ago -
Magnesium and nitrogen react in a combination reaction to
produce magnesium nitride. 3 Mg + N2...
asked 28 minutes ago -
Two electrons are initially at rest separated by a distance of
2nm. At time t=0, they...
asked 26 minutes ago -
A martial artist is practicing breaking 5 boards. He is able to
break aboard with probability...
asked 34 minutes ago -
The rate constant of a first-order reaction is 2.95 × 10⁻⁴ s−1
at 350.° C. If...
asked 36 minutes ago