Applied Econometrics
Use the dataset attached on blackboard and answer the following questions:
- First study the simple linear regression model for the heart attack death rates, on the only basis of the number of phones. Determine whether the number of phone is associated significantly with the heart attack death rate.
- Write the multiple linear regression model for the heart attack death rates on the basis of the number of phones and the proportion of saturated fat. Compute the associated least squares coefficient estimates.
- Test whether at least one of the predictors number of phones, or proportion of saturated fat, is useful in predicting the heart attack death rate.
- Compute the R2 statistic, and the residual standard error for the models in questions (b) and (c). Would you say that adding the proportion of saturated fat to the model significantly improves the accuracy?
- Write the multiple linear regression model for the heart attack rates on the basis of the number of phones, the proportion of saturated fat, and the proportion of animal fat. Compute the associated least squares coefficient.
- A country has the following features: 108 phones per 1000 inhabitants; 33% of saturated fat for men between the ages of 55 and 59; 7% of animal fat for men between the ages of 55 and 59.
Predict the heart attack death rate for men between the ages of 55 and 59 in that country.
- Which coefficient estimates are significantly non-zero?
Homework Answers
a) Deaths = +
(Phones) +
OUTPUT FROM EXCEL :
| SUMMARY OUTPUT | ||||||||
| Regression Statistics | ||||||||
| Multiple R | 0.469711 | |||||||
| R Square | 0.220628 | |||||||
| Adjusted R Square | 0.18166 | |||||||
| Standard Error | 17.46597 | |||||||
| Observations | 22 | |||||||
| ANOVA | ||||||||
| df | SS | MS | F | Significance F | ||||
| Regression | 1 | 1727.159 | 1727.159 | 5.661698 | 0.027409 | |||
| Residual | 20 | 6101.205 | 305.0602 | |||||
| Total | 21 | 7828.364 | ||||||
| Coefficients | Standard Error | t Stat | P-value | Lower 95% | Upper 95% | Lower 95.0% | Upper 95.0% | |
| Intercept | 46.23633 | 5.771113 | 8.011684 | 0.000 | 34.198 | 58.27466 | 34.198 | 58.27466 |
| PHONES | 0.120021 | 0.050441 | 2.379432 | 0.027409 | 0.014803 | 0.225239 | 0.014803 | 0.225239 |
Confidence interval is 95%
Since P values of both intercept term and Parameter for Phone is less than 0.05, we can say that there is a significant impact of no.of phones on deaths.
R2 of the model is 0.22 i.e. 22% of variation in deaths is explained by phones.
b) Deaths = +
1
(Phones) +
2 (saturated fats)
+
EXCEL OUTPUT:
| SUMMARY OUTPUT | ||||||||
| Regression Statistics | ||||||||
| Multiple R | 0.489542 | |||||||
| R Square | 0.239651 | |||||||
| Adjusted R Square | 0.159614 | |||||||
| Standard Error | 17.69967 | |||||||
| Observations | 22 | |||||||
| ANOVA | ||||||||
| df | SS | MS | F | Significance F | ||||
| Regression | 2 | 1876.075 | 938.0374 | 2.994262 | 0.074067 | |||
| Residual | 19 | 5952.289 | 313.2784 | |||||
| Total | 21 | 7828.364 | ||||||
| Coefficients | Standard Error | t Stat | P-value | Lower 95% | Upper 95% | Lower 95.0% | Upper 95.0% | |
| Intercept | 35.55464 | 16.56005 | 2.147013 | 0.044912 | 0.894065 | 70.21522 | 0.894065 | 70.21522 |
| PHONES | 0.07895 | 0.078495 | 1.005803 | 0.327149 | -0.08534 | 0.243242 | -0.08534 | 0.243242 |
| SATURATED | 0.470729 | 0.682757 | 0.689454 | 0.498872 | -0.9583 | 1.899755 | -0.9583 | 1.899755 |
= 35.55
1 =
0.07
2 =
0.47
c) Neither of the coefficient is significant as P values are more than 0.05 for both variables.
d) R2 is 0.23 i.e 23% of variation in deaths is explained by saturated fats and phones. So, no the model is not improved significantly by addition of saturated fat variable.
| RESIDUAL OUTPUT | |||||
| Observation | Predicted DEATHS | Residuals | Standard Residuals | sum resid. | |
| 1 | 60.87855 | 20.12145 | 1.195163 | 0.000 | |
| 2 | 54.01581 | 0.984186 | 0.058458 | ||
| 3 | 67.73236 | 12.26764 | 0.728666 | ||
| 4 | 43.87284 | -19.8728 | -1.1804 | ||
| 5 | 46.70613 | 31.29387 | 1.858775 | ||
| 6 | 65.91353 | -13.9135 | -0.82643 | ||
| 7 | 55.59779 | 32.40221 | 1.924608 | ||
| 8 | 53.46911 | -8.46911 | -0.50304 | ||
| 9 | 55.42503 | -5.42503 | -0.32223 | ||
| 10 | 53.38421 | 15.61579 | 0.927538 | ||
| 11 | 47.72357 | 18.27643 | 1.085573 | ||
| 12 | 47.17686 | -2.17686 | -0.1293 | ||
| 13 | 40.58368 | -16.5837 | -0.98503 | ||
| 14 | 47.17092 | -4.17092 | -0.24774 | ||
| 15 | 57.94549 | -19.9455 | -1.18471 | ||
| 16 | 67.80537 | 4.194632 | 0.24915 | ||
| 17 | 63.31114 | -22.3111 | -1.32522 | ||
| 18 | 48.27028 | -10.2703 | -0.61003 | ||
| 19 | 71.36111 | -19.3611 | -1.15 | ||
| 20 | 64.58921 | -12.5892 | -0.74777 | ||
| 21 | 61.10053 | 4.899466 | 0.291016 | ||
| 22 | 73.96647 | 15.03353 | 0.892953 | ||
Sum of residual square is 0.
e) Deaths = +
1
(Phones) +
2 (saturated fats)
+
3(Animal
fats) +
EXCEL OUTPUT
| SUMMARY OUTPUT | ||||||||
| Regression Statistics | ||||||||
| Multiple R | 0.633586 | |||||||
| R Square | 0.401432 | |||||||
| Adjusted R Square | 0.30167 | |||||||
| Standard Error | 16.13452 | |||||||
| Observations | 22 | |||||||
| ANOVA | ||||||||
| df | SS | MS | F | Significance F | ||||
| Regression | 3 | 3142.553 | 1047.518 | 4.023917 | 0.023569 | |||
| Residual | 18 | 4685.811 | 260.3228 | |||||
| Total | 21 | 7828.364 | ||||||
| Coefficients | Standard Error | t Stat | P-value | Lower 95% | Upper 95% | Lower 95.0% | Upper 95.0% | |
| Intercept | 23.99957 | 15.97887 | 1.501957 | 0.150448 | -9.57079 | 57.56992 | -9.57079 | 57.56992 |
| PHONES | -0.00617 | 0.081298 | -0.07594 | 0.940308 | -0.17697 | 0.164627 | -0.17697 | 0.164627 |
| SATURATED | -0.47987 | 0.757034 | -0.63388 | 0.534132 | -2.07034 | 1.1106 | -2.07034 | 1.1106 |
| ANIMAL | 8.4835 | 3.846205 | 2.205681 | 0.040646 | 0.402924 | 16.56408 | 0.402924 | 16.56408 |
= 23.99
1 = -.006
2 = -0.47
3 = 8.48
Add Answer to:
Applied Econometrics
Use the dataset attached on blackboard and answer the following
questions:
First study the...
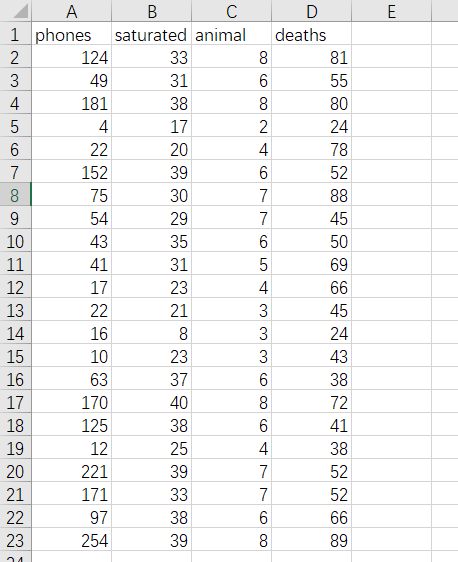
phones saturated animal deaths 124 33 8 81 49 31 6 55 181 38 8 80...
phones saturated animal deaths 124 33 8 81 49 31 6 55 181 38 8 80 4 17 2 24 22 20 4 78 152 39 6 52 75 30 7 88 54 29 7 45 43 35 6 50 41 31 5 69 17 23 4 66 22 21 3 45 16 8 3 24 10 23 3 43 63 37 6 38 170 40 8 72 125 38 6 41 12 25 4 38 221 39 7 52...
Spring 2019 Name, 33) If the 2 variables that we want to study are not mumeric, which method will we use to study their association? a) z2 table and calculations e) Normal distributions b) correl...
 Spring 2019 Name, 33) If the 2 variables that we want to study are not mumeric, which method will we use to study their association? a) z2 table and calculations e) Normal distributions b) correlation and regression d) hon-linear correlation 34) If there is a high correlation between variables, the causality relationship between therm a) x causes y b) coincidence e) x and y are caused by a third variable(s) d) all of these are possibilities For items 35)-36): Suppose...
Read the attached case completely. Then answer the questions that follow. CASE A new study has...
Read the attached case completely. Then answer the questions that follow. CASE A new study has found that eating as little as a quarter of an ounce of chocolate each day -- an amount equal to about one small Easter egg -- may lower your risk of experiencing a heart attack or stroke. For best results, the chocolate should be dark, experts say. "Dark chocolate exhibits the greatest effects, milk chocolate fewer, and white chocolate no effects," says the lead...
Regression and Correlation Methods: Correlation, ANOVA, and Least Squares This is another way of assessing the...
Regression and Correlation Methods: Correlation, ANOVA, and Least Squares This is another way of assessing the possible association between a normally distributed variable y and a categorical variable x. These techniques are special cases of linear regression methods. The purpose of the assignment is to demonstrate methods of regression and correlation analysis in which two different variables in the same sample are related. The following are three important statistics, or methodologies, for using correlation and regression: Pearson's correlation coefficient ANOVA...
**R-STUDIO KNOWLEDGE REQUIRED*** PLEASE ANSWER THE FOLLOWING WITH ****R-STUDIO**** CODING- thank ...
 **R-STUDIO KNOWLEDGE REQUIRED***
PLEASE ANSWER THE FOLLOWING WITH ****R-STUDIO****
CODING- thank you so much!!
I am specifically look for the solution to part
***(h)**** and *****(i)***** below using R-Studio
code:
The data set in question
is:
YEAR Height Stories
1990 770 54
1980 677 47
1990 428 28
1989 410 38
1966 371 29
1976 504 38
1974 1136 80
1991 695 52
1982 551 45
1986 550 40
1931 568 49
1979 504 33
1988 560 50
1973 512...
**R-STUDIO KNOWLEDGE REQUIRED***
PLEASE ANSWER THE FOLLOWING WITH ****R-STUDIO****
CODING- thank you so much!!
I am specifically look for the solution to part
***(h)**** and *****(i)***** below using R-Studio
code:
The data set in question
is:
YEAR Height Stories
1990 770 54
1980 677 47
1990 428 28
1989 410 38
1966 371 29
1976 504 38
1974 1136 80
1991 695 52
1982 551 45
1986 550 40
1931 568 49
1979 504 33
1988 560 50
1973 512...
Student stress at final exam time comes partly from the uncertainty of grades and the consequence...
 Student stress at final exam time comes partly from the
uncertainty of grades and the consequences of those grades. Can
knowledge of a midterm grade be used to predict a final exam grade?
A random sample of 200 BCOM students from recent years was taken
and their percentage grades on assignments, midterm exam, and final
exam were recorded. Let’s examine the ability of midterm and
assignment grades to predict final exam grades.
The data are shown here:
Assignment
Midterm
FinalExam...
Student stress at final exam time comes partly from the
uncertainty of grades and the consequences of those grades. Can
knowledge of a midterm grade be used to predict a final exam grade?
A random sample of 200 BCOM students from recent years was taken
and their percentage grades on assignments, midterm exam, and final
exam were recorded. Let’s examine the ability of midterm and
assignment grades to predict final exam grades.
The data are shown here:
Assignment
Midterm
FinalExam...
Please use Excel, and show all functions. 3. Answer the following question for where Y has...
 Please use Excel, and show all functions.
3. Answer the following question for where Y has been regressed on X1, X2, and X3. Use the linear regression output in the Excel file. Your answers should be rounded to 2 decimal places. a. What is the equation for the line of best fit or regression line? b. The proportion is for the amount of the variability of Y that is explained or accounted for by the model. C. The correlation between...
Please use Excel, and show all functions.
3. Answer the following question for where Y has been regressed on X1, X2, and X3. Use the linear regression output in the Excel file. Your answers should be rounded to 2 decimal places. a. What is the equation for the line of best fit or regression line? b. The proportion is for the amount of the variability of Y that is explained or accounted for by the model. C. The correlation between...
In a study on the estimation of attendance at the Fortifications of Quebec National Historic Site,...
 In a study on the estimation of attendance at the Fortifications of Quebec National Historic Site, we want to assess the reliability of magnetic counters used to measure the variation in temporal attendance. Three days of investigation were chosen to represent each day of the week and the evaluation took place over 23 days, and this in two schedules to cover attendance not only during the day, but also early in the evening. The number of people attending the Fortifications...
Use the Tornadoes Data and your statistical expertise to answer the questions: Is it reasonable to claim that the averag...
Use the Tornadoes Data and your statistical expertise to answer the questions: Is it reasonable to claim that the average number of observed tornadoes per year is different from the average number of tornado related deaths per year? 5. What test/procedure did you perform? a. One-sided t-test b. Two-sided t-test c. Regression d. Confidence interval 6. What is the P-Value/margin of error? a. 0.007034504 b. 0.34922 c. 4.07497E-24 d. 2.03749E-24 e. None of these 7. Statistical Interpretation a. Since P-value...
 Spring 2019 Name, 33) If the 2 variables that we want to study are not mumeric, which method will we use to study their association? a) z2 table and calculations e) Normal distributions b) correlation and regression d) hon-linear correlation 34) If there is a high correlation between variables, the causality relationship between therm a) x causes y b) coincidence e) x and y are caused by a third variable(s) d) all of these are possibilities For items 35)-36): Suppose...
 **R-STUDIO KNOWLEDGE REQUIRED***
PLEASE ANSWER THE FOLLOWING WITH ****R-STUDIO****
CODING- thank you so much!!
I am specifically look for the solution to part
***(h)**** and *****(i)***** below using R-Studio
code:
The data set in question
is:
YEAR Height Stories
1990 770 54
1980 677 47
1990 428 28
1989 410 38
1966 371 29
1976 504 38
1974 1136 80
1991 695 52
1982 551 45
1986 550 40
1931 568 49
1979 504 33
1988 560 50
1973 512...
**R-STUDIO KNOWLEDGE REQUIRED***
PLEASE ANSWER THE FOLLOWING WITH ****R-STUDIO****
CODING- thank you so much!!
I am specifically look for the solution to part
***(h)**** and *****(i)***** below using R-Studio
code:
The data set in question
is:
YEAR Height Stories
1990 770 54
1980 677 47
1990 428 28
1989 410 38
1966 371 29
1976 504 38
1974 1136 80
1991 695 52
1982 551 45
1986 550 40
1931 568 49
1979 504 33
1988 560 50
1973 512...
 Student stress at final exam time comes partly from the
uncertainty of grades and the consequences of those grades. Can
knowledge of a midterm grade be used to predict a final exam grade?
A random sample of 200 BCOM students from recent years was taken
and their percentage grades on assignments, midterm exam, and final
exam were recorded. Let’s examine the ability of midterm and
assignment grades to predict final exam grades.
The data are shown here:
Assignment
Midterm
FinalExam...
Student stress at final exam time comes partly from the
uncertainty of grades and the consequences of those grades. Can
knowledge of a midterm grade be used to predict a final exam grade?
A random sample of 200 BCOM students from recent years was taken
and their percentage grades on assignments, midterm exam, and final
exam were recorded. Let’s examine the ability of midterm and
assignment grades to predict final exam grades.
The data are shown here:
Assignment
Midterm
FinalExam...
 Please use Excel, and show all functions.
3. Answer the following question for where Y has been regressed on X1, X2, and X3. Use the linear regression output in the Excel file. Your answers should be rounded to 2 decimal places. a. What is the equation for the line of best fit or regression line? b. The proportion is for the amount of the variability of Y that is explained or accounted for by the model. C. The correlation between...
Please use Excel, and show all functions.
3. Answer the following question for where Y has been regressed on X1, X2, and X3. Use the linear regression output in the Excel file. Your answers should be rounded to 2 decimal places. a. What is the equation for the line of best fit or regression line? b. The proportion is for the amount of the variability of Y that is explained or accounted for by the model. C. The correlation between...
 In a study on the estimation of attendance at the Fortifications of Quebec National Historic Site, we want to assess the reliability of magnetic counters used to measure the variation in temporal attendance. Three days of investigation were chosen to represent each day of the week and the evaluation took place over 23 days, and this in two schedules to cover attendance not only during the day, but also early in the evening. The number of people attending the Fortifications...
Most questions answered within 3 hours.
-
Mark Gershon, owner of a musical instrument distributorship,
thinks that demand for guitars may be related...
asked 2 minutes ago -
Suppose that you were asked to construct a 95% confidence
interval based on the standard normal...
asked 10 minutes ago -
3 - What decimal number does the bit pattern 11001100 represent
if it is a:
•...
asked 12 minutes ago -
The copper(II) ion is acidic whereas the acetate ion is basic.
However, copper acetate is acidic....
asked 7 minutes ago -
A 48.53 mL volume of 1.00 M HCl was mixed with 47.70 mL of 2.00
M...
asked 29 minutes ago -
Neural cell types can be specified from ESCs with
retinoic acid, conditioned medium, co-cultures or by...
asked 34 minutes ago -
Can anyone solve: "Simulation with Arena 6th Edition - Chapter 8
- Question 3E"
8-3 Change...
asked 31 minutes ago -
What are some issues related to crimes, victims &
victimization that should be addressed?
asked 37 minutes ago -
Water flowing uniformly in a rectangular open channel has
manning value of 0.017, bottom slope of...
asked 1 hour ago -
Nature Conservancy's leader abruptly steps
down.
One morning in October 2007, Steven. J. McCormick the president...
asked 1 hour ago -
I asked a question similar to this one, which was answered
perfectly. Another practice problem is...
asked 1 hour ago -
Rachel is studying cholesterol synthesis in mice. Some mice
had a mutation in their sterol regulatory...
asked 1 hour ago