Student stress at final exam time comes partly from the uncertainty of grades and the consequences of those grades. Can knowledge of a midterm grade be used to predict a final exam grade? A random sample of 200 BCOM students from recent years was taken and their percentage grades on assignments, midterm exam, and final exam were recorded. Let’s examine the ability of midterm and assignment grades to predict final exam grades.
The data are shown here:
| Assignment | Midterm | FinalExam |
| 92 | 87 | 88 |
| 90 | 55 | 67 |
| 92 | 82 | 81 |
| 95 | 66 | 57 |
| 91 | 44 | 43 |
| 95 | 72 | 65 |
| 84 | 85 | 75 |
| 84 | 87 | 82 |
| 29 | 77 | 65 |
| 12 | 41 | 42 |
| 92 | 83 | 79 |
| 94 | 81 | 76 |
| 48 | 50 | 37 |
| 78 | 84 | 86 |
| 88 | 89 | 85 |
| 96 | 73 | 54 |
| 92 | 81 | 76 |
| 93 | 81 | 84 |
| 67 | 55 | 62 |
| 84 | 59 | 61 |
| 90 | 90 | 84 |
| 90 | 62 | 52 |
| 72 | 75 | 65 |
| 92 | 59 | 68 |
| 95 | 84 | 88 |
| 94 | 85 | 68 |
| 90 | 86 | 82 |
| 84 | 81 | 83 |
| 91 | 72 | 76 |
| 87 | 68 | 70 |
| 96 | 82 | 79 |
| 91 | 54 | 45 |
| 84 | 87 | 85 |
| 44 | 61 | 55 |
| 93 | 59 | 41 |
| 71 | 77 | 48 |
| 89 | 75 | 65 |
| 21 | 70 | 63 |
| 68 | 86 | 65 |
| 53 | 81 | 70 |
| 69 | 66 | 36 |
| 92 | 84 | 81 |
| 66 | 70 | 40 |
| 70 | 82 | 89 |
| 81 | 58 | 60 |
| 92 | 74 | 87 |
| 63 | 50 | 55 |
| 90 | 84 | 70 |
| 89 | 78 | 79 |
| 83 | 68 | 62 |
| 87 | 85 | 81 |
| 53 | 52 | 59 |
| 90 | 60 | 57 |
| 88 | 82 | 83 |
| 85 | 94 | 76 |
| 43 | 55 | 54 |
| 68 | 52 | 52 |
| 89 | 74 | 62 |
| 85 | 75 | 63 |
| 93 | 94 | 88 |
| 91 | 84 | 85 |
| 82 | 73 | 63 |
| 74 | 68 | 48 |
| 87 | 85 | 78 |
| 92 | 82 | 79 |
| 96 | 75 | 75 |
| 44 | 71 | 53 |
| 82 | 78 | 70 |
| 93 | 81 | 76 |
| 90 | 94 | 95 |
| 87 | 86 | 66 |
| 89 | 91 | 73 |
| 68 | 61 | 45 |
| 85 | 73 | 72 |
| 84 | 82 | 84 |
| 41 | 47 | 47 |
| 79 | 61 | 39 |
| 87 | 83 | 85 |
| 97 | 83 | 89 |
| 89 | 89 | 86 |
| 84 | 89 | 69 |
| 56 | 66 | 54 |
| 81 | 70 | 75 |
| 30 | 53 | 69 |
| 51 | 70 | 67 |
| 79 | 62 | 47 |
| 31 | 63 | 40 |
| 83 | 83 | 88 |
| 91 | 77 | 69 |
| 88 | 92 | 95 |
| 78 | 82 | 78 |
| 96 | 89 | 96 |
| 45 | 73 | 63 |
| 90 | 89 | 72 |
| 73 | 65 | 71 |
| 81 | 80 | 80 |
| 86 | 81 | 82 |
| 89 | 68 | 54 |
| 64 | 73 | 62 |
| 87 | 69 | 77 |
| 65 | 68 | 64 |
| 95 | 95 | 85 |
| 98 | 79 | 65 |
| 85 | 68 | 71 |
| 86 | 91 | 91 |
| 91 | 76 | 61 |
| 76 | 62 | 58 |
| 69 | 89 | 79 |
| 83 | 79 | 68 |
| 93 | 77 | 75 |
| 88 | 86 | 93 |
| 42 | 72 | 53 |
| 93 | 81 | 90 |
| 58 | 76 | 56 |
| 87 | 82 | 78 |
| 72 | 63 | 61 |
| 71 | 78 | 40 |
| 81 | 91 | 81 |
| 81 | 77 | 57 |
| 28 | 43 | 54 |
| 91 | 96 | 90 |
| 66 | 57 | 55 |
| 74 | 50 | 37 |
| 86 | 75 | 72 |
| 87 | 66 | 63 |
| 62 | 62 | 54 |
| 93 | 81 | 53 |
| 96 | 87 | 90 |
| 86 | 89 | 84 |
| 85 | 86 | 84 |
| 82 | 69 | 70 |
| 92 | 71 | 63 |
| 83 | 63 | 42 |
| 81 | 88 | 60 |
| 8 | 78 | 69 |
| 91 | 85 | 71 |
| 89 | 84 | 72 |
| 43 | 83 | 74 |
| 97 | 77 | 75 |
| 79 | 78 | 70 |
| 91 | 75 | 81 |
| 73 | 67 | 64 |
| 82 | 75 | 77 |
| 69 | 64 | 49 |
| 35 | 74 | 54 |
| 92 | 81 | 82 |
| 87 | 80 | 91 |
| 93 | 75 | 74 |
| 95 | 96 | 94 |
| 86 | 60 | 30 |
| 88 | 84 | 76 |
| 67 | 40 | 41 |
| 70 | 49 | 67 |
| 79 | 86 | 73 |
| 87 | 83 | 78 |
| 82 | 80 | 82 |
| 77 | 84 | 86 |
| 53 | 88 | 83 |
| 86 | 72 | 76 |
| 65 | 93 | 76 |
| 68 | 79 | 67 |
| 96 | 81 | 78 |
| 85 | 79 | 80 |
| 92 | 73 | 71 |
| 90 | 90 | 89 |
| 81 | 53 | 61 |
| 89 | 71 | 51 |
| 85 | 88 | 70 |
| 82 | 67 | 52 |
| 78 | 88 | 73 |
| 83 | 75 | 73 |
| 88 | 83 | 80 |
| 60 | 75 | 74 |
| 88 | 64 | 54 |
| 96 | 80 | 75 |
| 69 | 58 | 64 |
| 95 | 66 | 64 |
| 78 | 44 | 51 |
| 89 | 61 | 60 |
| 85 | 80 | 76 |
| 80 | 70 | 73 |
| 79 | 91 | 90 |
| 82 | 63 | 54 |
| 92 | 79 | 84 |
| 76 | 59 | 66 |
| 86 | 64 | 66 |
| 86 | 85 | 82 |
| 74 | 70 | 58 |
| 71 | 78 | 64 |
| 87 | 78 | 66 |
| 87 | 76 | 77 |
| 90 | 78 | 82 |
| 41 | 66 | 71 |
| 90 | 72 | 74 |
| 90 | 88 | 84 |
| 35 | 60 | 57 |
| 92 | 69 | 59 |
| 92 | 89 | 81 |
| 11 | 59 | 39 |
| 94 | 94 | 91 |


![Question 31 2 pts Continue with Exam Grades Complete the following one-sentence conclusion for the previous test I Select ]](http://img.homeworklib.com/images/1fbda586-4828-4b0f-9e12-b6664a223f28.png?x-oss-process=image/resize,w_560)


![Question 35 2 pts Continue with Exam Grades Complete the following one-sentence conclusion for the previous test. [ Select]](http://img.homeworklib.com/images/1b22f401-5e8b-4d98-a8f2-d4b3559a4e85.png?x-oss-process=image/resize,w_560)


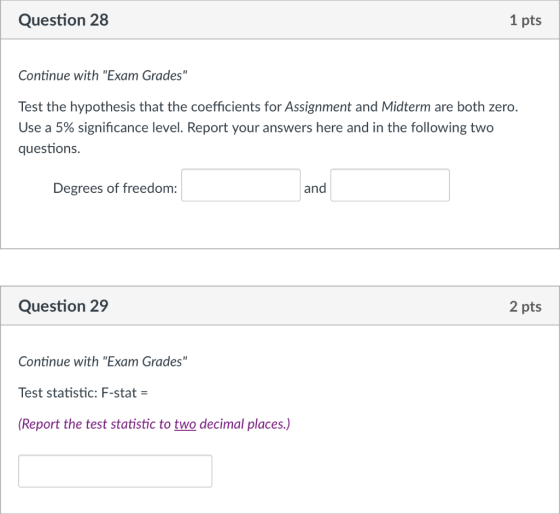
Question 28 1 pts Continue with "Exam Grades" Test the hypothesis that the coefficients for Assignment and Midterm are both zero. Use a 5% significance level. Report your answers here and in the following two questions. Degrees of freedom: and Question 29 2 pts Continue with "Exam Grades" Test statistic: F-stat- (Report the test statistic to two decimal places.)
Question 30 1 pts Continue with "Exam Grades" P-value (Report your answer to four decimal places. Type 0.0001 if the P-value is less than this amount.)
Question 31 2 pts Continue with "Exam Grades" Complete the following one-sentence conclusion for the previous test I Select ] do do not We conclude that Assignment and Midter contain information that can be used to predict FinalExam
Question 32 1 pts Continue with "Exam Grades" Use the multiple regression output (not a separate simple regression analysis!) to test the hypothesis that the coefficient for Assignment is zero. Use a 5% significance level. Test statistic: t-stat- Report the test statistic to two decimal places.) Question 33 1 pts Continue with "Exam Grades" For the t-stat you computed in the previous questions, the degrees of freedom
Question 34 1 pts Continue with "Exam Grades" For the t-stat you computed in Question 32, the P-value Report the P-value to four decimal places.)
Question 35 2 pts Continue with "Exam Grades" Complete the following one-sentence conclusion for the previous test There is Select ] evidence that the coefficient of Assignment Select I significantly different from zero.
Question 35 2 pts Continue with "Exam Grades" Complete the following one-sentence conclusion for the previous test. [ Select] no There evidence that the coefficient of Assignment [Select ] nifid weak moderate strong is is not
Question 35 2 pts Continue with "Exam Grades" Complete the following one-sentence conclusion for the previous test. There is [Select ] evidence that the coefficient of Assignme I Select ] no weak moderate strong iS is not significantly different from zero.
Question 36 4 pts Continue with "Exam Grades" Create a plot of the distribution of the residuals. Also plot the residuals versus each of the explanatory variables. Then answer the following True/False questions: A histogram of residuals is reasonably close to Normal. Both residual plots look good with basically horizontal bands around the x-axis. Only one of the residual plots looks good. Neither residual plot suggests any issues with the equal spread condition. [ Select ] [ Select ] [ Select ] [Select ]
Question 37 2 pts Continue with Exam Grades: Give an approximate 95% prediction interval for the final exam grade for a student whose assignment grade is 90% and whose midterm grade is 85%. Note: The same formula for an approximate 95% prediction interval in simple regression works also for multiple regression. For the approximate 95% prediction interval: Point estimate = Carry all precision in Excel and then round your answer to one decimal place) Question 38 2 pts Continue with "Exam Grades" For the approximate 95% prediction interval: Margin of error Carry all precision in Excel and then round your answer to one decimal place.)
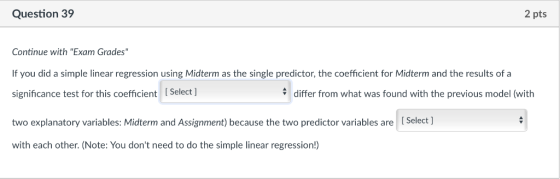
Question 39 2 pts Continue with "Exam Grades" If you did a simple linear regression using Midterm as the single predictor, the coefficient for Midterm and the results of a significance test for this coefficient Select ] two explanatory variables: Midterm and Assignment) because the two predictor variables are [Select ] with each other. (Note: You don't need to do the simple linear regression!) differ from what was found with the previous model (with
Question 39 2 pts Continue with "Exam Grades" If you did a simple linear regression using Midterm as the single predictor, the coefficient for Midterm and the results ofa significance test for this coefficie two explanatory variables: Midter with each other. (Note: You don't I Select ] would would not not correlated correlated differ from what was found with the previous model (with wo predictor variables are Select l gression!)
Question 39 2 pts Continue with "Exam Grades" If you did a simple linear regression using Midterm as the single predictor, the coefficient for Midterm and the results of a significance test for this coefficient [Select] two explanatory variables: Midterm and Assignment) because the two predictor variables a with each other. (Note: You don't need to do the simple linear regression!) differ from what was found with the previous model (with Select ] does does not not correlated correlated
Homework Answers
Solution:
install analysis tool pak in excel
go to data >data analysis regression
select the data

click on ok
Yu will get
| SUMMARY OUTPUT | ||||||
| Regression Statistics | ||||||
| Multiple R | 0.767005365 | |||||
| R Square | 0.58829723 | |||||
| Adjusted R Square | 0.584117506 | |||||
| Standard Error | 9.317061425 | |||||
| Observations | 200 | |||||
| ANOVA | ||||||
| df | SS | MS | F | Significance F | ||
| Regression | 2 | 24436.39618 | 12218.19809 | 140.7503 | 1.08769E-38 | |
| Residual | 197 | 17101.10382 | 86.8076336 | |||
| Total | 199 | 41537.5 | ||||
| Coefficients | Standard Error | t Stat | P-value | Lower 95% | Upper 95% | |
| Intercept | -0.791240512 | 4.262420844 | -0.18563172 | 0.852925 | -9.197071291 | click on oj |
| Assignment | 0.114220349 | 0.040101142 | 2.848306624 | 0.004862 | 0.035137727 | 0.193303 |
| Midterm | 0.816135191 | 0.058887499 | 13.8592266 | 6.19E-31 | 0.700004389 | 0.932266 |
ANSWERS ARE:
solution27:
r sq=0.5883
Solution28:
Degrees of freedom 2 and 197
Solution29:
F stat=140.75
Solution30:
p=0.0000
Solution31:
we can use regression eq to predict final exam
DO CONTAIN INFORMATION to predict final exam
Add Answer to:
Student stress at final exam time comes partly from the uncertainty of grades and the consequence...
The midterm and final exam grades for a statistics course are provided in the data set below. Jaymes, a student in the c...
The midterm and final exam grades for a statistics course are provided in the data set below. Jaymes, a student in the class, scored 86 on both exams. Treat the given data sets as samples. Jaymes's wants to know which grade is more unusual, the midterm grade or the final exam grade. Use Use a TI-83, TI-83 Plus, or TI-84 calculator to calculate the z-scores corresponding to each grade. Round your answer to three decimal places. Midterm 80, 78, 85,...
PLEASE SHOW ME HOW TO DO THIS.... For the Excel Data Set please find and report...
 PLEASE SHOW ME HOW TO DO THIS....
For
the Excel Data Set please find and report for Test 1 and Test 2 the
Mean, SD, and the tolerance levels for both for which there would
be any outliers (i.e., the value for which a score must be less
than to be consider an outlier and the value for which a number
must greater than to be considered an outlier.
See picture
Performance Data Group 1 1 1 1 Test 2...
PLEASE SHOW ME HOW TO DO THIS....
For
the Excel Data Set please find and report for Test 1 and Test 2 the
Mean, SD, and the tolerance levels for both for which there would
be any outliers (i.e., the value for which a score must be less
than to be consider an outlier and the value for which a number
must greater than to be considered an outlier.
See picture
Performance Data Group 1 1 1 1 Test 2...
Pitcher 1 Pitcher 2 87 82 86 92 82 70 84 96 83 89 81 84 85 84 93 ...
 Pitcher 1
Pitcher 2
87
82
86
92
82
70
84
96
83
89
81
84
85
84
93
80
86
81
85
89
84
86
92
72
83
77
84
87
80
89
87
93
88
78
87
81
79
82
82
87
82
81
87
84
80
88
88
93
90
80
85
79
86
87
87
74
86
78
85
80
85
83
88
79
84
95
83
81
88
89
87
91
94
93
83
91...
Pitcher 1
Pitcher 2
87
82
86
92
82
70
84
96
83
89
81
84
85
84
93
80
86
81
85
89
84
86
92
72
83
77
84
87
80
89
87
93
88
78
87
81
79
82
82
87
82
81
87
84
80
88
88
93
90
80
85
79
86
87
87
74
86
78
85
80
85
83
88
79
84
95
83
81
88
89
87
91
94
93
83
91...
5. Mark’s class just took the admission test for business school and averaged 87.05. Chapter 10...
5. Mark’s class just took the admission test for business school and averaged 87.05. Chapter 10 Data Set 2 contains the population of scores for the 10 other classes in Mark’s university. How did Mark’s class do? Class 1 Class 2 Class 3 Class 4 Class 5 Class 6 Class 7 Class 8 Class 9 Class 10 78 81 96 85 88 78 90 79 96 86 77 78 97 90 88 82 86 93 87 89 78 93 88...
3.3 Table 3.10 shows the scores in the final examination F and the scores in two preliminary exam...
 3.3 Table 3.10 shows the scores in the final examination F and the scores in two preliminary examinations P1 and P2 for 22 students in a statistics course. The data can be found in the book's Web site. (a) Fit each of the following models to the data: Model 1 F Bo BiP Model 2 F- Model 3 : F-k) + AP,+AP, + ε Table 3.10 Examination Data: Scores in the Final (F), First Preliminary (Pi), and Second Preliminary (P2)...
Consider the below matrixA, which you can copy and paste directly into Matlab.
Problem #1: Consider the below matrix A, which you can copy and paste directly into Matlab. The matrix contains 3 columns. The first column consists of Test #1 marks, the second column is Test # 2 marks, and the third column is final exam marks for a large linear algebra course. Each row represents a particular student.A = [36 45 75 81 59 73 77 73 73 65 72 78 65 55 83 73 57 78 84 31 60 83...
The given data is the grades for people in this class. The goal here is to...
 The given data is the grades for people in this class. The goal here is to determine the factors that effect student's Grade in the class. 4) Find the mean and median for the men's and the women's Quizzes. Gender Men Women 5) Test the claim that the majority of students at this class are women. F M F F M F F F F M M F F F M F F F F M M F F M...
Midterm1 = (83.33, 98.33, 75, 91.67, 96.67, 95, 86.67, 65, 100, 100, 80, 88.33, 96.67, 96.67,...
 Midterm1 = (83.33, 98.33, 75, 91.67, 96.67, 95, 86.67, 65, 100,
100, 80, 88.33,
96.67, 96.67, 90, 96.67, 86.67, 93.33, 80, 91.67, 98.33, 86.67, 85,
86.67, 95,
83.33, 96.67, 81.67, 98.33, 100, 95, 93.33, 91.67, 88.33, 98.33,
93.33, 98.33,
93.33, 85, 88.33, 100, 98.33, 96.67, 90, 86.67, 100, 96.67, 98.33,
90, 96.67,
86.67, 95, 78.33, 86.67, 100, 81.67, 96.67, 91.67, 96.67, 96.67,
95, 96.67, 73.33,
100, 93.33, 96.67, 88.33, 70, 96.67, 96.67, 100, 88.33, 96.67, 100,
88.33, 100,
78.33, 93.33,...
Midterm1 = (83.33, 98.33, 75, 91.67, 96.67, 95, 86.67, 65, 100,
100, 80, 88.33,
96.67, 96.67, 90, 96.67, 86.67, 93.33, 80, 91.67, 98.33, 86.67, 85,
86.67, 95,
83.33, 96.67, 81.67, 98.33, 100, 95, 93.33, 91.67, 88.33, 98.33,
93.33, 98.33,
93.33, 85, 88.33, 100, 98.33, 96.67, 90, 86.67, 100, 96.67, 98.33,
90, 96.67,
86.67, 95, 78.33, 86.67, 100, 81.67, 96.67, 91.67, 96.67, 96.67,
95, 96.67, 73.33,
100, 93.33, 96.67, 88.33, 70, 96.67, 96.67, 100, 88.33, 96.67, 100,
88.33, 100,
78.33, 93.33,...
Please compute your z -don't use a package State your conclusion in plain English - not...
 Please compute your z -don't use a package State your conclusion in plain English - not just rejection 1 Students in the online class are suspicious that their schools 60 point loss may have caused their teacher to take out his frustration on the students by giving them a harder than usual exam. They manage to hack into his computer and get the following data: Scores for test Nov 2011 71 74 64 77 58 72 73 79 50 78...
The following scores represent the final examination grades for an elementary statistics course:
The following scores represent the final examination grades for an elementary statistics course: 23 60 79 32 57 74 52 70 82 36 80 77 81 95 41 65 92 85 55 76 52 10 64 75 78 25 80 98 81 67 41 71 83 54 64 72 88 62 74 43 60 78 89 76 84 48 84 90 15 79 34 67 17 82 69 74 63 80 85 61 Calculate: Stem and leaf Relative frequency histogram Cumulative frequency Sample Mean Sample Median Mode Variance Standard deviation
 PLEASE SHOW ME HOW TO DO THIS....
For
the Excel Data Set please find and report for Test 1 and Test 2 the
Mean, SD, and the tolerance levels for both for which there would
be any outliers (i.e., the value for which a score must be less
than to be consider an outlier and the value for which a number
must greater than to be considered an outlier.
See picture
Performance Data Group 1 1 1 1 Test 2...
PLEASE SHOW ME HOW TO DO THIS....
For
the Excel Data Set please find and report for Test 1 and Test 2 the
Mean, SD, and the tolerance levels for both for which there would
be any outliers (i.e., the value for which a score must be less
than to be consider an outlier and the value for which a number
must greater than to be considered an outlier.
See picture
Performance Data Group 1 1 1 1 Test 2...
 Pitcher 1
Pitcher 2
87
82
86
92
82
70
84
96
83
89
81
84
85
84
93
80
86
81
85
89
84
86
92
72
83
77
84
87
80
89
87
93
88
78
87
81
79
82
82
87
82
81
87
84
80
88
88
93
90
80
85
79
86
87
87
74
86
78
85
80
85
83
88
79
84
95
83
81
88
89
87
91
94
93
83
91...
Pitcher 1
Pitcher 2
87
82
86
92
82
70
84
96
83
89
81
84
85
84
93
80
86
81
85
89
84
86
92
72
83
77
84
87
80
89
87
93
88
78
87
81
79
82
82
87
82
81
87
84
80
88
88
93
90
80
85
79
86
87
87
74
86
78
85
80
85
83
88
79
84
95
83
81
88
89
87
91
94
93
83
91...
 3.3 Table 3.10 shows the scores in the final examination F and the scores in two preliminary examinations P1 and P2 for 22 students in a statistics course. The data can be found in the book's Web site. (a) Fit each of the following models to the data: Model 1 F Bo BiP Model 2 F- Model 3 : F-k) + AP,+AP, + ε Table 3.10 Examination Data: Scores in the Final (F), First Preliminary (Pi), and Second Preliminary (P2)...
 The given data is the grades for people in this class. The goal here is to determine the factors that effect student's Grade in the class. 4) Find the mean and median for the men's and the women's Quizzes. Gender Men Women 5) Test the claim that the majority of students at this class are women. F M F F M F F F F M M F F F M F F F F M M F F M...
 Midterm1 = (83.33, 98.33, 75, 91.67, 96.67, 95, 86.67, 65, 100,
100, 80, 88.33,
96.67, 96.67, 90, 96.67, 86.67, 93.33, 80, 91.67, 98.33, 86.67, 85,
86.67, 95,
83.33, 96.67, 81.67, 98.33, 100, 95, 93.33, 91.67, 88.33, 98.33,
93.33, 98.33,
93.33, 85, 88.33, 100, 98.33, 96.67, 90, 86.67, 100, 96.67, 98.33,
90, 96.67,
86.67, 95, 78.33, 86.67, 100, 81.67, 96.67, 91.67, 96.67, 96.67,
95, 96.67, 73.33,
100, 93.33, 96.67, 88.33, 70, 96.67, 96.67, 100, 88.33, 96.67, 100,
88.33, 100,
78.33, 93.33,...
Midterm1 = (83.33, 98.33, 75, 91.67, 96.67, 95, 86.67, 65, 100,
100, 80, 88.33,
96.67, 96.67, 90, 96.67, 86.67, 93.33, 80, 91.67, 98.33, 86.67, 85,
86.67, 95,
83.33, 96.67, 81.67, 98.33, 100, 95, 93.33, 91.67, 88.33, 98.33,
93.33, 98.33,
93.33, 85, 88.33, 100, 98.33, 96.67, 90, 86.67, 100, 96.67, 98.33,
90, 96.67,
86.67, 95, 78.33, 86.67, 100, 81.67, 96.67, 91.67, 96.67, 96.67,
95, 96.67, 73.33,
100, 93.33, 96.67, 88.33, 70, 96.67, 96.67, 100, 88.33, 96.67, 100,
88.33, 100,
78.33, 93.33,...
 Please compute your z -don't use a package State your conclusion in plain English - not just rejection 1 Students in the online class are suspicious that their schools 60 point loss may have caused their teacher to take out his frustration on the students by giving them a harder than usual exam. They manage to hack into his computer and get the following data: Scores for test Nov 2011 71 74 64 77 58 72 73 79 50 78...
Most questions answered within 3 hours.
-
A medical researcher
believes that a drug changes the body's temperature. Seven test
subjects are randomly...
asked 13 minutes ago -
A call option on Project Cash Flow Consulting Inc.'s stock (PCF)
has a market price of...
asked 14 minutes ago -
A study on the latest fad diet claimed that the amounts of
weight lost by all...
asked 29 minutes ago -
give examples of how gene expression is inherited to the next
generation?
asked 25 minutes ago -
If a project has _________ IRR(s), we should __________ . Assume
this project is competing with...
asked 30 minutes ago -
In the figure, a sound of wavelength 0.700 m is emitted
isotropically by point source S....
asked 41 minutes ago -
1) Stock X has a beta of 1.6. If the risk free rate is 3.4
percent...
asked 40 minutes ago -
Gallium is produced by the electrolysis of a solution obtained
by dissolving gallium oxide in concentrated...
asked 48 minutes ago -
A small company that manufactures juggling equipment makes 19
different types of clubs. The company wants...
asked 52 minutes ago -
Discrete structures
please help!!
Use Fermat's little theorem to find the remainder when
91000 is divided...
asked 1 hour ago -
A 295-kg log is pulled up a ramp by means of a rope that is
parallel...
asked 1 hour ago -
An investor has two bonds in her portfolio, Bond C and Bond Z.
Each bond matures...
asked 57 minutes ago