PLEASE SHOW ME HOW TO DO THIS....
 For
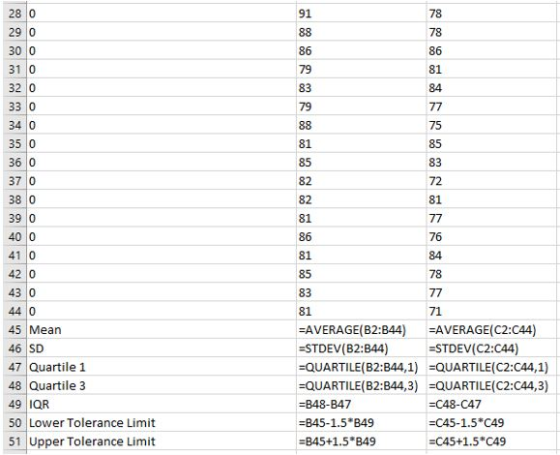
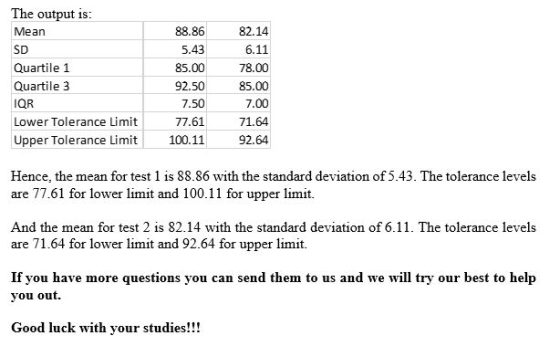
the Excel Data Set please find and report for Test 1 and Test 2 the
Mean, SD, and the tolerance levels for both for which there would
be any outliers (i.e., the value for which a score must be less
than to be consider an outlier and the value for which a number
must greater than to be considered an outlier.
For
the Excel Data Set please find and report for Test 1 and Test 2 the
Mean, SD, and the tolerance levels for both for which there would
be any outliers (i.e., the value for which a score must be less
than to be consider an outlier and the value for which a number
must greater than to be considered an outlier.
See picture
Homework Answers

Add Answer to:
PLEASE SHOW ME HOW TO DO THIS....
For
the Excel Data Set please find and report...
5. Mark’s class just took the admission test for business school and averaged 87.05. Chapter 10...
5. Mark’s class just took the admission test for business school and averaged 87.05. Chapter 10 Data Set 2 contains the population of scores for the 10 other classes in Mark’s university. How did Mark’s class do? Class 1 Class 2 Class 3 Class 4 Class 5 Class 6 Class 7 Class 8 Class 9 Class 10 78 81 96 85 88 78 90 79 96 86 77 78 97 90 88 82 86 93 87 89 78 93 88...
Pitcher 1 Pitcher 2 87 82 86 92 82 70 84 96 83 89 81 84 85 84 93 ...
 Pitcher 1
Pitcher 2
87
82
86
92
82
70
84
96
83
89
81
84
85
84
93
80
86
81
85
89
84
86
92
72
83
77
84
87
80
89
87
93
88
78
87
81
79
82
82
87
82
81
87
84
80
88
88
93
90
80
85
79
86
87
87
74
86
78
85
80
85
83
88
79
84
95
83
81
88
89
87
91
94
93
83
91...
Pitcher 1
Pitcher 2
87
82
86
92
82
70
84
96
83
89
81
84
85
84
93
80
86
81
85
89
84
86
92
72
83
77
84
87
80
89
87
93
88
78
87
81
79
82
82
87
82
81
87
84
80
88
88
93
90
80
85
79
86
87
87
74
86
78
85
80
85
83
88
79
84
95
83
81
88
89
87
91
94
93
83
91...
Consider the below matrixA, which you can copy and paste directly into Matlab.
Problem #1: Consider the below matrix A, which you can copy and paste directly into Matlab. The matrix contains 3 columns. The first column consists of Test #1 marks, the second column is Test # 2 marks, and the third column is final exam marks for a large linear algebra course. Each row represents a particular student.A = [36 45 75 81 59 73 77 73 73 65 72 78 65 55 83 73 57 78 84 31 60 83...
3.3 Table 3.10 shows the scores in the final examination F and the scores in two preliminary exam...
 3.3 Table 3.10 shows the scores in the final examination F and the scores in two preliminary examinations P1 and P2 for 22 students in a statistics course. The data can be found in the book's Web site. (a) Fit each of the following models to the data: Model 1 F Bo BiP Model 2 F- Model 3 : F-k) + AP,+AP, + ε Table 3.10 Examination Data: Scores in the Final (F), First Preliminary (Pi), and Second Preliminary (P2)...
Student stress at final exam time comes partly from the uncertainty of grades and the consequence...
 Student stress at final exam time comes partly from the
uncertainty of grades and the consequences of those grades. Can
knowledge of a midterm grade be used to predict a final exam grade?
A random sample of 200 BCOM students from recent years was taken
and their percentage grades on assignments, midterm exam, and final
exam were recorded. Let’s examine the ability of midterm and
assignment grades to predict final exam grades.
The data are shown here:
Assignment
Midterm
FinalExam...
Student stress at final exam time comes partly from the
uncertainty of grades and the consequences of those grades. Can
knowledge of a midterm grade be used to predict a final exam grade?
A random sample of 200 BCOM students from recent years was taken
and their percentage grades on assignments, midterm exam, and final
exam were recorded. Let’s examine the ability of midterm and
assignment grades to predict final exam grades.
The data are shown here:
Assignment
Midterm
FinalExam...
Chapter 13 Data Set 3 contains the average sales for five stores across four seasons. Which season was the best of all f...
 Chapter 13 Data Set 3 contains the average sales for five stores
across four seasons. Which season was the best of all for
sales?
Figure 13.3 Data for a Single-Factor Analysis of Variance A C Group 1 Group 2 Group 3 (5 hours) (10 Hours) (20 Hours) 1 87 87 89 3 86 85 91 76 99 96 56 85 87 78 79 89 7 98 81 90 77 82 89 66 78 96 10 75 85 96 11 67...
Chapter 13 Data Set 3 contains the average sales for five stores
across four seasons. Which season was the best of all for
sales?
Figure 13.3 Data for a Single-Factor Analysis of Variance A C Group 1 Group 2 Group 3 (5 hours) (10 Hours) (20 Hours) 1 87 87 89 3 86 85 91 76 99 96 56 85 87 78 79 89 7 98 81 90 77 82 89 66 78 96 10 75 85 96 11 67...
1. Forecast demand for Year 4. a. Explain what technique you utilized to forecast your demand....
 1. Forecast demand for Year 4.
a. Explain what technique you utilized to forecast your
demand.
b. Explain why you chose this technique over others.
Year 3 Year 1 Year 2 Actual Actual Actual Forecast Forecast Forecast Demand Demand Demand Week 1 52 57 63 55 66 77 Week 2 49 58 68 69 75 65 Week 3 47 50 58 65 80 74 Week 4 60 53 58 55 78 67 57 Week 5 49 57 64 76 77...
1. Forecast demand for Year 4.
a. Explain what technique you utilized to forecast your
demand.
b. Explain why you chose this technique over others.
Year 3 Year 1 Year 2 Actual Actual Actual Forecast Forecast Forecast Demand Demand Demand Week 1 52 57 63 55 66 77 Week 2 49 58 68 69 75 65 Week 3 47 50 58 65 80 74 Week 4 60 53 58 55 78 67 57 Week 5 49 57 64 76 77...
Midterm1 = (83.33, 98.33, 75, 91.67, 96.67, 95, 86.67, 65, 100, 100, 80, 88.33, 96.67, 96.67,...
 Midterm1 = (83.33, 98.33, 75, 91.67, 96.67, 95, 86.67, 65, 100,
100, 80, 88.33,
96.67, 96.67, 90, 96.67, 86.67, 93.33, 80, 91.67, 98.33, 86.67, 85,
86.67, 95,
83.33, 96.67, 81.67, 98.33, 100, 95, 93.33, 91.67, 88.33, 98.33,
93.33, 98.33,
93.33, 85, 88.33, 100, 98.33, 96.67, 90, 86.67, 100, 96.67, 98.33,
90, 96.67,
86.67, 95, 78.33, 86.67, 100, 81.67, 96.67, 91.67, 96.67, 96.67,
95, 96.67, 73.33,
100, 93.33, 96.67, 88.33, 70, 96.67, 96.67, 100, 88.33, 96.67, 100,
88.33, 100,
78.33, 93.33,...
Midterm1 = (83.33, 98.33, 75, 91.67, 96.67, 95, 86.67, 65, 100,
100, 80, 88.33,
96.67, 96.67, 90, 96.67, 86.67, 93.33, 80, 91.67, 98.33, 86.67, 85,
86.67, 95,
83.33, 96.67, 81.67, 98.33, 100, 95, 93.33, 91.67, 88.33, 98.33,
93.33, 98.33,
93.33, 85, 88.33, 100, 98.33, 96.67, 90, 86.67, 100, 96.67, 98.33,
90, 96.67,
86.67, 95, 78.33, 86.67, 100, 81.67, 96.67, 91.67, 96.67, 96.67,
95, 96.67, 73.33,
100, 93.33, 96.67, 88.33, 70, 96.67, 96.67, 100, 88.33, 96.67, 100,
88.33, 100,
78.33, 93.33,...
USE R AND SHOW CODES!! The IQ was measured for 35 twins. Is there any difference...
USE R AND SHOW CODES!! The IQ was measured for 35 twins. Is there any difference in IQ between twins? DATA Twin 1 Twin 2 113 109 94 100 99 86 77 80 81 95 91 106 111 117 104 107 85 85 66 84 111 125 51 66 109 108 122 121 97 98 82 94 100 88 100 104 93 84 99 95 109 98 95 100 75 86 104 103 73 78 88 99 92 111 108...
A math test was given to five randomly selected schools. The result of the exams is...
A math test was given to five randomly selected schools. The result of the exams is given in the following table. School 1: 72 83 92 97 82 75 68 93 School 2: 75 81 95 92 88 70 70 90 97 84 76 School 3: 82 73 99 90 66 77 School 4: 71 85 91 95 89 73 70 96 92 83 71 58 63 89 School 5: 82 85 79 90 86 77 71 86 90 73...
 Pitcher 1
Pitcher 2
87
82
86
92
82
70
84
96
83
89
81
84
85
84
93
80
86
81
85
89
84
86
92
72
83
77
84
87
80
89
87
93
88
78
87
81
79
82
82
87
82
81
87
84
80
88
88
93
90
80
85
79
86
87
87
74
86
78
85
80
85
83
88
79
84
95
83
81
88
89
87
91
94
93
83
91...
Pitcher 1
Pitcher 2
87
82
86
92
82
70
84
96
83
89
81
84
85
84
93
80
86
81
85
89
84
86
92
72
83
77
84
87
80
89
87
93
88
78
87
81
79
82
82
87
82
81
87
84
80
88
88
93
90
80
85
79
86
87
87
74
86
78
85
80
85
83
88
79
84
95
83
81
88
89
87
91
94
93
83
91...
 3.3 Table 3.10 shows the scores in the final examination F and the scores in two preliminary examinations P1 and P2 for 22 students in a statistics course. The data can be found in the book's Web site. (a) Fit each of the following models to the data: Model 1 F Bo BiP Model 2 F- Model 3 : F-k) + AP,+AP, + ε Table 3.10 Examination Data: Scores in the Final (F), First Preliminary (Pi), and Second Preliminary (P2)...
 Student stress at final exam time comes partly from the
uncertainty of grades and the consequences of those grades. Can
knowledge of a midterm grade be used to predict a final exam grade?
A random sample of 200 BCOM students from recent years was taken
and their percentage grades on assignments, midterm exam, and final
exam were recorded. Let’s examine the ability of midterm and
assignment grades to predict final exam grades.
The data are shown here:
Assignment
Midterm
FinalExam...
Student stress at final exam time comes partly from the
uncertainty of grades and the consequences of those grades. Can
knowledge of a midterm grade be used to predict a final exam grade?
A random sample of 200 BCOM students from recent years was taken
and their percentage grades on assignments, midterm exam, and final
exam were recorded. Let’s examine the ability of midterm and
assignment grades to predict final exam grades.
The data are shown here:
Assignment
Midterm
FinalExam...
 Chapter 13 Data Set 3 contains the average sales for five stores
across four seasons. Which season was the best of all for
sales?
Figure 13.3 Data for a Single-Factor Analysis of Variance A C Group 1 Group 2 Group 3 (5 hours) (10 Hours) (20 Hours) 1 87 87 89 3 86 85 91 76 99 96 56 85 87 78 79 89 7 98 81 90 77 82 89 66 78 96 10 75 85 96 11 67...
Chapter 13 Data Set 3 contains the average sales for five stores
across four seasons. Which season was the best of all for
sales?
Figure 13.3 Data for a Single-Factor Analysis of Variance A C Group 1 Group 2 Group 3 (5 hours) (10 Hours) (20 Hours) 1 87 87 89 3 86 85 91 76 99 96 56 85 87 78 79 89 7 98 81 90 77 82 89 66 78 96 10 75 85 96 11 67...
 1. Forecast demand for Year 4.
a. Explain what technique you utilized to forecast your
demand.
b. Explain why you chose this technique over others.
Year 3 Year 1 Year 2 Actual Actual Actual Forecast Forecast Forecast Demand Demand Demand Week 1 52 57 63 55 66 77 Week 2 49 58 68 69 75 65 Week 3 47 50 58 65 80 74 Week 4 60 53 58 55 78 67 57 Week 5 49 57 64 76 77...
1. Forecast demand for Year 4.
a. Explain what technique you utilized to forecast your
demand.
b. Explain why you chose this technique over others.
Year 3 Year 1 Year 2 Actual Actual Actual Forecast Forecast Forecast Demand Demand Demand Week 1 52 57 63 55 66 77 Week 2 49 58 68 69 75 65 Week 3 47 50 58 65 80 74 Week 4 60 53 58 55 78 67 57 Week 5 49 57 64 76 77...
 Midterm1 = (83.33, 98.33, 75, 91.67, 96.67, 95, 86.67, 65, 100,
100, 80, 88.33,
96.67, 96.67, 90, 96.67, 86.67, 93.33, 80, 91.67, 98.33, 86.67, 85,
86.67, 95,
83.33, 96.67, 81.67, 98.33, 100, 95, 93.33, 91.67, 88.33, 98.33,
93.33, 98.33,
93.33, 85, 88.33, 100, 98.33, 96.67, 90, 86.67, 100, 96.67, 98.33,
90, 96.67,
86.67, 95, 78.33, 86.67, 100, 81.67, 96.67, 91.67, 96.67, 96.67,
95, 96.67, 73.33,
100, 93.33, 96.67, 88.33, 70, 96.67, 96.67, 100, 88.33, 96.67, 100,
88.33, 100,
78.33, 93.33,...
Midterm1 = (83.33, 98.33, 75, 91.67, 96.67, 95, 86.67, 65, 100,
100, 80, 88.33,
96.67, 96.67, 90, 96.67, 86.67, 93.33, 80, 91.67, 98.33, 86.67, 85,
86.67, 95,
83.33, 96.67, 81.67, 98.33, 100, 95, 93.33, 91.67, 88.33, 98.33,
93.33, 98.33,
93.33, 85, 88.33, 100, 98.33, 96.67, 90, 86.67, 100, 96.67, 98.33,
90, 96.67,
86.67, 95, 78.33, 86.67, 100, 81.67, 96.67, 91.67, 96.67, 96.67,
95, 96.67, 73.33,
100, 93.33, 96.67, 88.33, 70, 96.67, 96.67, 100, 88.33, 96.67, 100,
88.33, 100,
78.33, 93.33,...
Most questions answered within 3 hours.
-
A statistics student finds herself struggling with a newspaper
article stating that only eighteen percent of...
asked 17 minutes ago -
People with beriberi, a disease caused by a thiamin deficiency,
have elevated levels of blood pyruvate...
asked 3 minutes ago -
PYTHON Programming Exercise 2: Create a Simple Cost Calculator
Write a program that displays input fields...
asked 9 minutes ago -
1.Seki agreed that Groupon could sell 18 hot air
balloon rides on his Magical Adventures company...
asked 10 minutes ago -
A cohort study is conducted to determine whether smoking is
associated with an increased risk of...
asked 16 minutes ago -
Create the pseudo-code/flowchart for an application class named
Monogram. Its main() method inputs three variables that...
asked 16 minutes ago -
How many liters of water are required to dissolve 1.00 g of
silver chromate? Express your...
asked 19 minutes ago -
Hot: T_inlet = 80, T_out = 65
Cold: T_inlet = 10, T_out = 25
Explain in...
asked 20 minutes ago -
Two protons fly in different directions and collide. They both
have a total energy of 1.5...
asked 29 minutes ago -
What is the oxidation number of each atom in sodium phosphate,
Na3PO4?
>>> SHOW YOUR WORK...
asked 35 minutes ago -
D company purchased goods with a list price of $60000, subject
to trade discounts of 20%...
asked 37 minutes ago -
Transposable elements make up more than 40% of the human genome
and are inserted more-or-less randomly...
asked 48 minutes ago