Chapter 13 Data Set 3 contains the average sales for five stores
across four seasons. Which season was the best of all for
sales?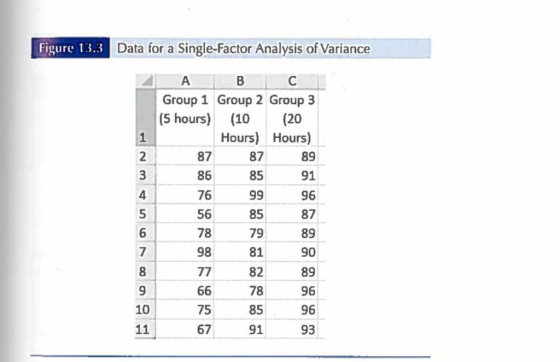
Homework Answers

Conclusion: if F > F crit, we reject the null hypothesis. This is the case, 8.80 > 3.35. Therefore, we reject the null hypothesis. The means of the three populations are not all equal. At least one of the means is different. However, the ANOVA does not tell you where the difference lies.
Group 3 looks different because average value is 91.6 and it has very less variance than other two groups
Add Answer to:
Chapter 13 Data Set 3 contains the average sales for five stores across four seasons. Which season was the best of all f...
5. Mark’s class just took the admission test for business school and averaged 87.05. Chapter 10...
5. Mark’s class just took the admission test for business school and averaged 87.05. Chapter 10 Data Set 2 contains the population of scores for the 10 other classes in Mark’s university. How did Mark’s class do? Class 1 Class 2 Class 3 Class 4 Class 5 Class 6 Class 7 Class 8 Class 9 Class 10 78 81 96 85 88 78 90 79 96 86 77 78 97 90 88 82 86 93 87 89 78 93 88...
PLEASE SHOW ME HOW TO DO THIS.... For the Excel Data Set please find and report...
 PLEASE SHOW ME HOW TO DO THIS....
For
the Excel Data Set please find and report for Test 1 and Test 2 the
Mean, SD, and the tolerance levels for both for which there would
be any outliers (i.e., the value for which a score must be less
than to be consider an outlier and the value for which a number
must greater than to be considered an outlier.
See picture
Performance Data Group 1 1 1 1 Test 2...
PLEASE SHOW ME HOW TO DO THIS....
For
the Excel Data Set please find and report for Test 1 and Test 2 the
Mean, SD, and the tolerance levels for both for which there would
be any outliers (i.e., the value for which a score must be less
than to be consider an outlier and the value for which a number
must greater than to be considered an outlier.
See picture
Performance Data Group 1 1 1 1 Test 2...
Consider the below matrixA, which you can copy and paste directly into Matlab.
Problem #1: Consider the below matrix A, which you can copy and paste directly into Matlab. The matrix contains 3 columns. The first column consists of Test #1 marks, the second column is Test # 2 marks, and the third column is final exam marks for a large linear algebra course. Each row represents a particular student.A = [36 45 75 81 59 73 77 73 73 65 72 78 65 55 83 73 57 78 84 31 60 83...
1. Forecast demand for Year 4. a. Explain what technique you utilized to forecast your demand....
 1. Forecast demand for Year 4.
a. Explain what technique you utilized to forecast your
demand.
b. Explain why you chose this technique over others.
Year 3 Year 1 Year 2 Actual Actual Actual Forecast Forecast Forecast Demand Demand Demand Week 1 52 57 63 55 66 77 Week 2 49 58 68 69 75 65 Week 3 47 50 58 65 80 74 Week 4 60 53 58 55 78 67 57 Week 5 49 57 64 76 77...
1. Forecast demand for Year 4.
a. Explain what technique you utilized to forecast your
demand.
b. Explain why you chose this technique over others.
Year 3 Year 1 Year 2 Actual Actual Actual Forecast Forecast Forecast Demand Demand Demand Week 1 52 57 63 55 66 77 Week 2 49 58 68 69 75 65 Week 3 47 50 58 65 80 74 Week 4 60 53 58 55 78 67 57 Week 5 49 57 64 76 77...
Use the accompanying data set on the pulse rates (in beats per minute) of males to...
Use the accompanying data set on the pulse rates (in beats per minute) of males to complete parts (a) and (b) below. LOADING... Click the icon to view the pulse rates of males. a. Find the mean and standard deviation, and verify that the pulse rates have a distribution that is roughly normal. The mean of the pulse rates is 71.871.8 beats per minute. (Round to one decimal place as needed.) The standard deviation of the pulse rates is 12.212.2...
8. The following data are scores from a Physics final administered to 34 students. 81 76...
 8. The following data are scores from a Physics final administered to 34 students. 81 76 93 99 47 67 69 72 83 88 56 62 91 94 98 63 77 84 98 75 79 67 73 65 89 86 91 85 97 73 56 92 88 83 Use the Chart below to construct a Frequency Distribution with 5 classes (15 pts) Class Tally (This column is optional.) Frequency
Question 9-15 are based on the random sample below which is obtained to test the following hypoth...
Question 9-15 are based on the random sample below which is obtained to test the following hypothesis about the population mean. Test the hypothesis that the mean is less than 80. 80 100 81 93 80 57 98 90 71 56 58 78 59 55 55 77 72 78 56 94 98 59 93 86 89 62 60 66 59 71 96 97 94 69 64 77 87 77 64 90 90 95 98 99 56 69 72 81 95...
How do you find the difference of mean for a data set???? Here are my numbers...
How do you find the difference of mean for a data set???? Here are my numbers drinking soda (15 min after) 91 69 82 66 76 66 92 72 89 78 74 99 69 86 58 80 66 60 76 78 82 77 80 88 74 68 92 67 96 75 75 94 75 70 74 80 96 67 80 76 80 82 64 80
Pitcher 1 Pitcher 2 87 82 86 92 82 70 84 96 83 89 81 84 85 84 93 ...
 Pitcher 1
Pitcher 2
87
82
86
92
82
70
84
96
83
89
81
84
85
84
93
80
86
81
85
89
84
86
92
72
83
77
84
87
80
89
87
93
88
78
87
81
79
82
82
87
82
81
87
84
80
88
88
93
90
80
85
79
86
87
87
74
86
78
85
80
85
83
88
79
84
95
83
81
88
89
87
91
94
93
83
91...
Pitcher 1
Pitcher 2
87
82
86
92
82
70
84
96
83
89
81
84
85
84
93
80
86
81
85
89
84
86
92
72
83
77
84
87
80
89
87
93
88
78
87
81
79
82
82
87
82
81
87
84
80
88
88
93
90
80
85
79
86
87
87
74
86
78
85
80
85
83
88
79
84
95
83
81
88
89
87
91
94
93
83
91...
QUESTION 27 Problem 5) Final scores of all the students in randomly selected 3 sections in...
 QUESTION 27 Problem 5) Final scores of all the students in randomly selected 3 sections in a course, "Statistical Methods at Sam Houston State University we presented below. There are 25 sections in total Section 3: (69.92, 66, 81, 76, 55, 70, 83, 68, 57, 80, 66, 69, 55, 88, 70, 70, 70, 56, 50) Section 6: (10, 73, 88, 58, 89, 69, 63, 76, 87, 82, 97, 76, 66, 95, 84, 88, 82, 81, 68, 89) Section 9: (30,...
 PLEASE SHOW ME HOW TO DO THIS....
For
the Excel Data Set please find and report for Test 1 and Test 2 the
Mean, SD, and the tolerance levels for both for which there would
be any outliers (i.e., the value for which a score must be less
than to be consider an outlier and the value for which a number
must greater than to be considered an outlier.
See picture
Performance Data Group 1 1 1 1 Test 2...
PLEASE SHOW ME HOW TO DO THIS....
For
the Excel Data Set please find and report for Test 1 and Test 2 the
Mean, SD, and the tolerance levels for both for which there would
be any outliers (i.e., the value for which a score must be less
than to be consider an outlier and the value for which a number
must greater than to be considered an outlier.
See picture
Performance Data Group 1 1 1 1 Test 2...
 1. Forecast demand for Year 4.
a. Explain what technique you utilized to forecast your
demand.
b. Explain why you chose this technique over others.
Year 3 Year 1 Year 2 Actual Actual Actual Forecast Forecast Forecast Demand Demand Demand Week 1 52 57 63 55 66 77 Week 2 49 58 68 69 75 65 Week 3 47 50 58 65 80 74 Week 4 60 53 58 55 78 67 57 Week 5 49 57 64 76 77...
1. Forecast demand for Year 4.
a. Explain what technique you utilized to forecast your
demand.
b. Explain why you chose this technique over others.
Year 3 Year 1 Year 2 Actual Actual Actual Forecast Forecast Forecast Demand Demand Demand Week 1 52 57 63 55 66 77 Week 2 49 58 68 69 75 65 Week 3 47 50 58 65 80 74 Week 4 60 53 58 55 78 67 57 Week 5 49 57 64 76 77...
 8. The following data are scores from a Physics final administered to 34 students. 81 76 93 99 47 67 69 72 83 88 56 62 91 94 98 63 77 84 98 75 79 67 73 65 89 86 91 85 97 73 56 92 88 83 Use the Chart below to construct a Frequency Distribution with 5 classes (15 pts) Class Tally (This column is optional.) Frequency
 Pitcher 1
Pitcher 2
87
82
86
92
82
70
84
96
83
89
81
84
85
84
93
80
86
81
85
89
84
86
92
72
83
77
84
87
80
89
87
93
88
78
87
81
79
82
82
87
82
81
87
84
80
88
88
93
90
80
85
79
86
87
87
74
86
78
85
80
85
83
88
79
84
95
83
81
88
89
87
91
94
93
83
91...
Pitcher 1
Pitcher 2
87
82
86
92
82
70
84
96
83
89
81
84
85
84
93
80
86
81
85
89
84
86
92
72
83
77
84
87
80
89
87
93
88
78
87
81
79
82
82
87
82
81
87
84
80
88
88
93
90
80
85
79
86
87
87
74
86
78
85
80
85
83
88
79
84
95
83
81
88
89
87
91
94
93
83
91...
 QUESTION 27 Problem 5) Final scores of all the students in randomly selected 3 sections in a course, "Statistical Methods at Sam Houston State University we presented below. There are 25 sections in total Section 3: (69.92, 66, 81, 76, 55, 70, 83, 68, 57, 80, 66, 69, 55, 88, 70, 70, 70, 56, 50) Section 6: (10, 73, 88, 58, 89, 69, 63, 76, 87, 82, 97, 76, 66, 95, 84, 88, 82, 81, 68, 89) Section 9: (30,...
Most questions answered within 3 hours.
-
(Expected rate of return and risk) Carter Inc. is evaluating a
security. Calculate the investment’s expected...
asked 2 hours ago -
What specific indicators can point to lack of progress for
African Americans in American society?
asked 3 hours ago -
1-The Electrons in a beam are moving at 2.7×10⁸ m/s in an
electric field of 15000...
asked 3 hours ago -
A gas tank is a vertical cylinder. It has a radius of 1m, a
height of...
asked 3 hours ago -
Accent Software faces the following conditions. All of these
support Accent’s use of a market-penetration pricing...
asked 4 hours ago -
A mathematically inclined friend emails you the following
instructions: "Meet me in the cafeteria the first...
asked 4 hours ago -
A monopoly sells in two countries . The demand curves in the two
countries are p1...
asked 5 hours ago -
A .15kg rubber ball is bounced off a wall. Before hitting the
wall, the ball moves...
asked 6 hours ago -
A manufacturing company preparing to build a new plant is
considering three potential locations for it....
asked 6 hours ago -
B. If compound Y has approximately the same values of solubility
in toluene as compound X,...
asked 7 hours ago -
Oscar Inc. has inventory in Japan valued at 39,051,000 Yen one
year ago. One year ago...
asked 7 hours ago -
If Canada suffered from "fundamental disequilibrium," and its
government choose not to devalue its currency, a...
asked 7 hours ago