
Homework Answers


Add Answer to:
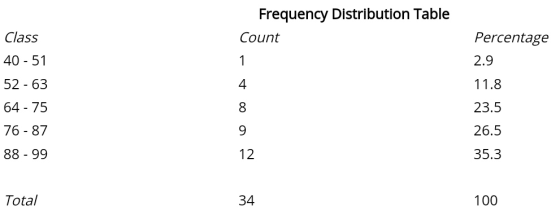
8. The following data are scores from a Physics final administered to 34 students. 81 76...
Consider the below matrixA, which you can copy and paste directly into Matlab.
Problem #1: Consider the below matrix A, which you can copy and paste directly into Matlab. The matrix contains 3 columns. The first column consists of Test #1 marks, the second column is Test # 2 marks, and the third column is final exam marks for a large linear algebra course. Each row represents a particular student.A = [36 45 75 81 59 73 77 73 73 65 72 78 65 55 83 73 57 78 84 31 60 83...
1. Forecast demand for Year 4. a. Explain what technique you utilized to forecast your demand....
 1. Forecast demand for Year 4.
a. Explain what technique you utilized to forecast your
demand.
b. Explain why you chose this technique over others.
Year 3 Year 1 Year 2 Actual Actual Actual Forecast Forecast Forecast Demand Demand Demand Week 1 52 57 63 55 66 77 Week 2 49 58 68 69 75 65 Week 3 47 50 58 65 80 74 Week 4 60 53 58 55 78 67 57 Week 5 49 57 64 76 77...
1. Forecast demand for Year 4.
a. Explain what technique you utilized to forecast your
demand.
b. Explain why you chose this technique over others.
Year 3 Year 1 Year 2 Actual Actual Actual Forecast Forecast Forecast Demand Demand Demand Week 1 52 57 63 55 66 77 Week 2 49 58 68 69 75 65 Week 3 47 50 58 65 80 74 Week 4 60 53 58 55 78 67 57 Week 5 49 57 64 76 77...
Find the indicated measure. The test scores of 40 students are listed below. Find P85.
Find the indicated measure. The test scores of 40 students are listed below. Find P85. 30 35 43 44 47 48 54 55 56 57 59 62 63 65 66 68 69 69 71 72 72 73 74 76 77 77 78 79 80 81 81 82 83 85 89 92 93 94 97 98 1) 85 2) 87 3) 89 4) 34
Find the indicated measure. The test scores of 40 students are listed below. Find P85. 30...
 Find the indicated measure. The test scores of 40 students are listed below. Find P85. 30 35 43 44 47 48 54 55 56 57 59 62 63 65 66 68 69 69 71 72 72 73 74 76 77 77 78 79 80 81 81 82 83 85 89 92 93 94 97 98 1) 85 2) 87 3) 89 4) 34
QUESTION 27 Problem 5) Final scores of all the students in randomly selected 3 sections in...
 QUESTION 27 Problem 5) Final scores of all the students in randomly selected 3 sections in a course, "Statistical Methods at Sam Houston State University we presented below. There are 25 sections in total Section 3: (69.92, 66, 81, 76, 55, 70, 83, 68, 57, 80, 66, 69, 55, 88, 70, 70, 70, 56, 50) Section 6: (10, 73, 88, 58, 89, 69, 63, 76, 87, 82, 97, 76, 66, 95, 84, 88, 82, 81, 68, 89) Section 9: (30,...
PLEASE SHOW ME HOW TO DO THIS.... For the Excel Data Set please find and report...
 PLEASE SHOW ME HOW TO DO THIS....
For
the Excel Data Set please find and report for Test 1 and Test 2 the
Mean, SD, and the tolerance levels for both for which there would
be any outliers (i.e., the value for which a score must be less
than to be consider an outlier and the value for which a number
must greater than to be considered an outlier.
See picture
Performance Data Group 1 1 1 1 Test 2...
PLEASE SHOW ME HOW TO DO THIS....
For
the Excel Data Set please find and report for Test 1 and Test 2 the
Mean, SD, and the tolerance levels for both for which there would
be any outliers (i.e., the value for which a score must be less
than to be consider an outlier and the value for which a number
must greater than to be considered an outlier.
See picture
Performance Data Group 1 1 1 1 Test 2...
3.3 Table 3.10 shows the scores in the final examination F and the scores in two preliminary exam...
 3.3 Table 3.10 shows the scores in the final examination F and the scores in two preliminary examinations P1 and P2 for 22 students in a statistics course. The data can be found in the book's Web site. (a) Fit each of the following models to the data: Model 1 F Bo BiP Model 2 F- Model 3 : F-k) + AP,+AP, + ε Table 3.10 Examination Data: Scores in the Final (F), First Preliminary (Pi), and Second Preliminary (P2)...
Question 9-15 are based on the random sample below which is obtained to test the following hypoth...
Question 9-15 are based on the random sample below which is obtained to test the following hypothesis about the population mean. Test the hypothesis that the mean is less than 80. 80 100 81 93 80 57 98 90 71 56 58 78 59 55 55 77 72 78 56 94 98 59 93 86 89 62 60 66 59 71 96 97 94 69 64 77 87 77 64 90 90 95 98 99 56 69 72 81 95...
5. Mark’s class just took the admission test for business school and averaged 87.05. Chapter 10...
5. Mark’s class just took the admission test for business school and averaged 87.05. Chapter 10 Data Set 2 contains the population of scores for the 10 other classes in Mark’s university. How did Mark’s class do? Class 1 Class 2 Class 3 Class 4 Class 5 Class 6 Class 7 Class 8 Class 9 Class 10 78 81 96 85 88 78 90 79 96 86 77 78 97 90 88 82 86 93 87 89 78 93 88...
QUESTION 23 Problem 5) True False Final scores of all the students in randomly selected 3...
 QUESTION 23 Problem 5) True False Final scores of all the students in randomly selected 3 sections in a course, "Statistical Methods tot Sam Houston State University are presented below. There me 25 sections in total Section 3: (69.92, 66, 81, 76, 55, 70, 83, 68, 57, 50, 66, 69, 55, 88, 70, 70, 70, 56, 50) Section 6: (10, 73, 88, 58, 89, 69, 63, 76, 87, 82, 97, 76, 66, 95, 84, 88, 82, 81, 68, 89) Section...
 1. Forecast demand for Year 4.
a. Explain what technique you utilized to forecast your
demand.
b. Explain why you chose this technique over others.
Year 3 Year 1 Year 2 Actual Actual Actual Forecast Forecast Forecast Demand Demand Demand Week 1 52 57 63 55 66 77 Week 2 49 58 68 69 75 65 Week 3 47 50 58 65 80 74 Week 4 60 53 58 55 78 67 57 Week 5 49 57 64 76 77...
1. Forecast demand for Year 4.
a. Explain what technique you utilized to forecast your
demand.
b. Explain why you chose this technique over others.
Year 3 Year 1 Year 2 Actual Actual Actual Forecast Forecast Forecast Demand Demand Demand Week 1 52 57 63 55 66 77 Week 2 49 58 68 69 75 65 Week 3 47 50 58 65 80 74 Week 4 60 53 58 55 78 67 57 Week 5 49 57 64 76 77...
 Find the indicated measure. The test scores of 40 students are listed below. Find P85. 30 35 43 44 47 48 54 55 56 57 59 62 63 65 66 68 69 69 71 72 72 73 74 76 77 77 78 79 80 81 81 82 83 85 89 92 93 94 97 98 1) 85 2) 87 3) 89 4) 34
 QUESTION 27 Problem 5) Final scores of all the students in randomly selected 3 sections in a course, "Statistical Methods at Sam Houston State University we presented below. There are 25 sections in total Section 3: (69.92, 66, 81, 76, 55, 70, 83, 68, 57, 80, 66, 69, 55, 88, 70, 70, 70, 56, 50) Section 6: (10, 73, 88, 58, 89, 69, 63, 76, 87, 82, 97, 76, 66, 95, 84, 88, 82, 81, 68, 89) Section 9: (30,...
 PLEASE SHOW ME HOW TO DO THIS....
For
the Excel Data Set please find and report for Test 1 and Test 2 the
Mean, SD, and the tolerance levels for both for which there would
be any outliers (i.e., the value for which a score must be less
than to be consider an outlier and the value for which a number
must greater than to be considered an outlier.
See picture
Performance Data Group 1 1 1 1 Test 2...
PLEASE SHOW ME HOW TO DO THIS....
For
the Excel Data Set please find and report for Test 1 and Test 2 the
Mean, SD, and the tolerance levels for both for which there would
be any outliers (i.e., the value for which a score must be less
than to be consider an outlier and the value for which a number
must greater than to be considered an outlier.
See picture
Performance Data Group 1 1 1 1 Test 2...
 3.3 Table 3.10 shows the scores in the final examination F and the scores in two preliminary examinations P1 and P2 for 22 students in a statistics course. The data can be found in the book's Web site. (a) Fit each of the following models to the data: Model 1 F Bo BiP Model 2 F- Model 3 : F-k) + AP,+AP, + ε Table 3.10 Examination Data: Scores in the Final (F), First Preliminary (Pi), and Second Preliminary (P2)...
 QUESTION 23 Problem 5) True False Final scores of all the students in randomly selected 3 sections in a course, "Statistical Methods tot Sam Houston State University are presented below. There me 25 sections in total Section 3: (69.92, 66, 81, 76, 55, 70, 83, 68, 57, 50, 66, 69, 55, 88, 70, 70, 70, 56, 50) Section 6: (10, 73, 88, 58, 89, 69, 63, 76, 87, 82, 97, 76, 66, 95, 84, 88, 82, 81, 68, 89) Section...
Most questions answered within 3 hours.
-
Please write 6 to 10 paragraphs on the risks associated with
digging an underground hole.
Write...
asked 1 minute ago -
The function x = (7.9 m) cos[(4πrad/s)t + π/3 rad] gives the
simple harmonic motion of...
asked 2 minutes ago -
A sample of steam with a mass of 0.501 g at a temperature of 100
∘C...
asked 35 minutes ago -
I1(t) and I2(t) describe the intensity of two
light waves.
I1(t)= 10sin(30t+π/4)
I2(t)=
10sin(30.4t+π)
Assume that...
asked 29 minutes ago -
True or False: Spinal nerves emerging from the vertebral column
are ONLY motor OR sensory.
Select...
asked 16 minutes ago -
last question i found wrong so downvoted so dont copy
paste or dont try if you...
asked 12 minutes ago -
A block sits on the floor. (a) What is the magnitude of the
frictional force on...
asked 36 minutes ago -
Thanks so much for the help! Please show all work.
A uniform solid disk with radius...
asked 16 minutes ago -
Please use Logicly!
Create a 4 bit sequential counter that is capable of counting up
or...
asked 25 minutes ago -
state one specific part from disability law such as ADA
(Americans with Disability Acts) or policy...
asked 37 minutes ago -
please simplify how vapor pressure lowering is related to a
rise in the boiling point solution
asked 51 minutes ago -
write a java program that does the following
Part one
Use a For loop to compute...
asked 49 minutes ago