
Homework Answers
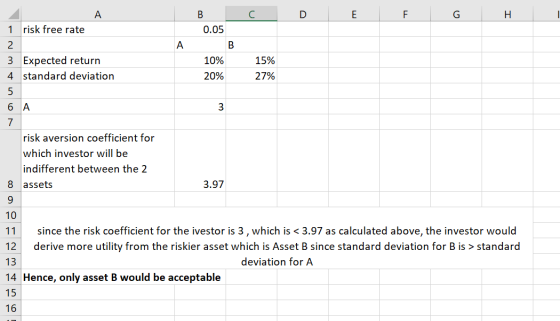

Here the utility function used is U = Expected return - 0.5*A* Variance
A = risk aversion coefficient
we have equated the Utility function for the assets to get the Risk aversion coefficient for which the investor will be indifferent between Asset A & B
Add Answer to:
am i Saved Two assets have the following expected returns and standard deviations when the risk-free...
1.3 (5 points) Two stocks have the following expected returns and standard deviations Stock Stock Expected...
 1.3 (5 points) Two stocks have the following expected returns and standard deviations Stock Stock Expected return Standard Deviation A 10% 12% B 15% 20% Consider a portfolio of A and B, and let w, and wg denote the portfolio weights of these two assets, with W + W, =1. Suppose that the correlation between the expected returns on A and B is equal to 0.3. Use these data to construct the portfolio of A and B with the lowest...
2. Consider an economy with 2 risky assets and one risk free asset. Two investors, A...
 2. Consider an economy with 2 risky assets and one risk free asset. Two investors, A and B, have mean-variance utility functions (with different risk aversion coef- ficients). Let P denote investor A's optimal portfolio of risky and risk-free assets and let Q denote investor B's optimal portfolio of risky and risk-free assets. P and Q have expected returns and standard deviations given by P Q E[R] St. Dev. 0.2 0.45 0.1 0.25 (a) What is the risk-free interest rate...
The table below provides the information of the expected returns, and the standard deviations of two...
 The table below provides the information of the expected returns, and the standard deviations of two assets A and B, as well as that of the market portfolio and the risk-free asset, respectively. Asset M (Market portfolio) F(Risk-free) Expected Return Standard Deviation 20% 15 % 4% 0% 10% 8 % 24 % 22 % B Table 04 (a) On the risk-return diagram, draw the Security Market Line and show all the four assets. (Be sure to place the values and...
You are presented with information on expected returns and standard deviations for 2 assets and a...
 You are presented with information on expected returns and standard deviations for 2 assets and a portfolio that was formed with equal proportions of each asset. Asset J Asset K 00800 0.1200 0.0914 Asset L Portfolio Expected return 0.03 0.0767 Variance 0.0842 0.0566 Which of the following statements is true (there are several, select all that are correct): If you want to decrease the risk (standard deviation) of the portfolio, you will increase the proportion to invest in asset J...
Stocks A & B have the expected returns and standard deviations shown in the table below:...
 Stocks A & B have the expected returns and standard deviations shown in the table below: Stock E(R) 12% 30% 19% 50% The correlation between A and B is 0.4. The risk-free rate is 3% and you have a risk-aversion parameter of 2. What is the proportion of your investment in A and B, respectively, in your optimal risky portfolio?
Suppose the expected returns and standard deviations of Stocks A and B are E(RA) = .088,...
 Suppose the expected returns and standard
deviations of Stocks A and B are E(RA) = .088, E(RB) = .148, σA =
.358, and σB = .618.
Suppose the expected returns and standard deviations of Stocks A and B are E(RA) = .088, E(RB) = .148, 0A = .358, and 0B = .618. a-1. Calculate the expected return of a portfolio that is composed of 33 percent A and 67 percent B when the correlation between the returns on A and...
Suppose the expected returns and standard
deviations of Stocks A and B are E(RA) = .088, E(RB) = .148, σA =
.358, and σB = .618.
Suppose the expected returns and standard deviations of Stocks A and B are E(RA) = .088, E(RB) = .148, 0A = .358, and 0B = .618. a-1. Calculate the expected return of a portfolio that is composed of 33 percent A and 67 percent B when the correlation between the returns on A and...
a. Given the following holding-period returns, compute the average returns and the standard deviations for the...
 a. Given the following holding-period returns, compute the
average returns and the standard deviations for the Zemin
Corporation and for the market.
b. If Zemin's beta is 1.98 and the risk-free rate is 7
percent, what would be an expected return for an investor owning
Zemin? (Note: Because the preceding returns are based on monthly
data, you will need to annualize the returns to make them
comparable with the risk-free rate. For simplicity, you can
convert from monthly to...
a. Given the following holding-period returns, compute the
average returns and the standard deviations for the Zemin
Corporation and for the market.
b. If Zemin's beta is 1.98 and the risk-free rate is 7
percent, what would be an expected return for an investor owning
Zemin? (Note: Because the preceding returns are based on monthly
data, you will need to annualize the returns to make them
comparable with the risk-free rate. For simplicity, you can
convert from monthly to...
Consider the following data about the expected returns, standard deviations, and correlation between two assets: Asset...
Consider the following data about the expected returns, standard deviations, and correlation between two assets: Asset 1 Asset 2 Expected return 5.3% 6.8% Standard deviation 4.5% 7.8% Correlation coefficient -0.6 Calculate the expected return and standard deviation of a portfolio consisting of a 20% weight in asset 1 and an 80% weight in asset 2. What happens to the expected return and standard deviation of the portfolio when the weight combination changes to 50% in asset 1 and 50% in...
a. Given the following holding period returns, compute the average returns and the standard deviations for...
 a. Given the following holding period returns, compute the average returns and the standard deviations for the Zen Corporation and for the market b. Zomb is 106 and ther e is 7 percent we would be an expected return for an investor o m Because the precedings are based on m to make them comprate with skrerateFor simplicity you can convert from m y to your by gyng e rgement returns by 12) C. How does Zem's historical average retum...
The universe of available securities includes two risky stocks A and B, and a risk-free asset....
The universe of available securities includes two risky stocks A and B, and a risk-free asset. The data for the universe are as follows: Assets Expected Return Standard Deviation Stock A 6% 25% Stock B 12% 42% Risk free 5% 0 The correlation coefficient between A and B is -0.2. The investor maximizes a utility function U=E(r)−σ2 (i.e. she has a coefficient of risk aversion equal to 2). Assume that to maximize his utility when there is no available risk-free...
 1.3 (5 points) Two stocks have the following expected returns and standard deviations Stock Stock Expected return Standard Deviation A 10% 12% B 15% 20% Consider a portfolio of A and B, and let w, and wg denote the portfolio weights of these two assets, with W + W, =1. Suppose that the correlation between the expected returns on A and B is equal to 0.3. Use these data to construct the portfolio of A and B with the lowest...
 2. Consider an economy with 2 risky assets and one risk free asset. Two investors, A and B, have mean-variance utility functions (with different risk aversion coef- ficients). Let P denote investor A's optimal portfolio of risky and risk-free assets and let Q denote investor B's optimal portfolio of risky and risk-free assets. P and Q have expected returns and standard deviations given by P Q E[R] St. Dev. 0.2 0.45 0.1 0.25 (a) What is the risk-free interest rate...
 The table below provides the information of the expected returns, and the standard deviations of two assets A and B, as well as that of the market portfolio and the risk-free asset, respectively. Asset M (Market portfolio) F(Risk-free) Expected Return Standard Deviation 20% 15 % 4% 0% 10% 8 % 24 % 22 % B Table 04 (a) On the risk-return diagram, draw the Security Market Line and show all the four assets. (Be sure to place the values and...
 You are presented with information on expected returns and standard deviations for 2 assets and a portfolio that was formed with equal proportions of each asset. Asset J Asset K 00800 0.1200 0.0914 Asset L Portfolio Expected return 0.03 0.0767 Variance 0.0842 0.0566 Which of the following statements is true (there are several, select all that are correct): If you want to decrease the risk (standard deviation) of the portfolio, you will increase the proportion to invest in asset J...
 Stocks A & B have the expected returns and standard deviations shown in the table below: Stock E(R) 12% 30% 19% 50% The correlation between A and B is 0.4. The risk-free rate is 3% and you have a risk-aversion parameter of 2. What is the proportion of your investment in A and B, respectively, in your optimal risky portfolio?
 Suppose the expected returns and standard
deviations of Stocks A and B are E(RA) = .088, E(RB) = .148, σA =
.358, and σB = .618.
Suppose the expected returns and standard deviations of Stocks A and B are E(RA) = .088, E(RB) = .148, 0A = .358, and 0B = .618. a-1. Calculate the expected return of a portfolio that is composed of 33 percent A and 67 percent B when the correlation between the returns on A and...
Suppose the expected returns and standard
deviations of Stocks A and B are E(RA) = .088, E(RB) = .148, σA =
.358, and σB = .618.
Suppose the expected returns and standard deviations of Stocks A and B are E(RA) = .088, E(RB) = .148, 0A = .358, and 0B = .618. a-1. Calculate the expected return of a portfolio that is composed of 33 percent A and 67 percent B when the correlation between the returns on A and...
 a. Given the following holding-period returns, compute the
average returns and the standard deviations for the Zemin
Corporation and for the market.
b. If Zemin's beta is 1.98 and the risk-free rate is 7
percent, what would be an expected return for an investor owning
Zemin? (Note: Because the preceding returns are based on monthly
data, you will need to annualize the returns to make them
comparable with the risk-free rate. For simplicity, you can
convert from monthly to...
a. Given the following holding-period returns, compute the
average returns and the standard deviations for the Zemin
Corporation and for the market.
b. If Zemin's beta is 1.98 and the risk-free rate is 7
percent, what would be an expected return for an investor owning
Zemin? (Note: Because the preceding returns are based on monthly
data, you will need to annualize the returns to make them
comparable with the risk-free rate. For simplicity, you can
convert from monthly to...
 a. Given the following holding period returns, compute the average returns and the standard deviations for the Zen Corporation and for the market b. Zomb is 106 and ther e is 7 percent we would be an expected return for an investor o m Because the precedings are based on m to make them comprate with skrerateFor simplicity you can convert from m y to your by gyng e rgement returns by 12) C. How does Zem's historical average retum...
Most questions answered within 3 hours.
-
3. Gains from trade
Consider two neighbouring island countries called Euphoria and
Contente. They each have...
asked 12 minutes ago -
A business executive has the option to invest money in two
plans: Plan A guarantees that...
asked 2 hours ago -
Hello, can someone please help me answer this question?
How much heat is absorbed by a...
asked 2 hours ago -
. A marketing researcher conducted a survey of 25 shoppers
randomly selected at the local mall...
asked 2 hours ago -
Create an comprehensive response to the
following:
Antimicrobial agents work on a multitude of microbes (bacteria,...
asked 2 hours ago -
6.13 LAB: Step counter. Section 6.3.
A pedometer treats walking 2,000 steps as walking 1 mile....
asked 2 hours ago -
(14.2) A block of mass m = 10 kg riding on a frictionless
horizontal plane is...
asked 2 hours ago -
Use any search engine to search for articles about Starbucks
partnership with Tata Companies in India...
asked 2 hours ago -
Let’s say that for some reason Bank Excess Reserves suddenly
increase sharply. What effect would this...
asked 2 hours ago -
Given:
Curent Assets: $600,000
Total Assets: $2,600,000
Current Liabilities: $500,000
Total Liabilities: $1,700,000
What is the...
asked 3 hours ago -
1. What is a “Bankster”? What is insider trading? Why is it
illegal?
2. What is...
asked 2 hours ago -
A transverse wave on a cord is given by
D(x,t)=0.18sin(2.7x−61.0t), where Dand x are in m...
asked 3 hours ago