

Homework Answers
solution:
= P( 1.50< Z <2.25 )
= P(Z <2.25 ) - P(Z <1.50 )
Using z table,
= 0.9878-0.9332
=0.0546

b.
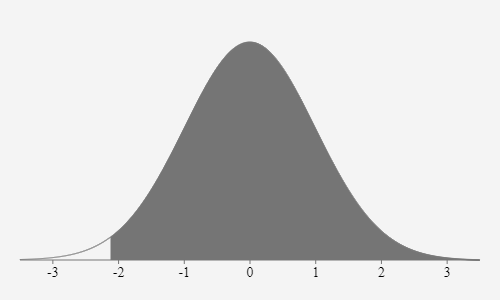
= P( -2.12< Z <3.73 )
= P(Z <3.73) - P(Z <-2.12 )
Using z table,
= 0.9999-0.0170
=0.9829
Add Answer to:
Assume that thermometer readings are normally distributed with a mean of 0°C and a standard deviation...
Assume that thermometer readings are normally distributed with a mean of O'C and a standard deviation...
 Assume that thermometer readings are normally distributed with a mean of O'C and a standard deviation of 1.00°C. A thermometer is randomly selected and tested For the case below, draw a sketch, and find the probability of the reading (The given values are in Celsius kres.) Between 0.75 and 1.50 Click to view page 1 of the table. Click to view page 2 of the table Draiv a sketch. Choose the correct graph belon ОА. -0.75 -1.50
Assume that thermometer readings are normally distributed with a mean of O'C and a standard deviation...
 Assume that thermometer readings are normally distributed with a mean of O'C and a standard deviation of 1.00'C. A thermometer in randomly selected and tested. For the case below. draw a sketch, and find the probability of the reading. (The given values are in Celsius degrees.) Between 0.75 and 1.75 Click to view page 1 of the table. Click to view page 2 of the table. ОА. OB GO The probability of getting a reading between 0.75°C and 1.75°C is...
Assume that thermometer readings are normally distributed with a mean of o°C and a standard deviation...
 Assume that thermometer readings are normally distributed with a mean of o°C and a standard deviation of 1.00°c. A thermometer is randomly selected and tested. For the case below, draw a sketch, and find the probability of the reading. (The given values are in Celsius degrees.) Between 0.25 and 1.25 Click to view page 1 of the table, Click to view page 2 of the table Draw a sketch. Choose the correct graph below A. Ов. Ос. z 0.25 1.25...
Assume the readings on thermometers are normally distributed with a mean of 0°C and a standard...
 Assume the readings on thermometers are normally distributed with a mean of 0°C and a standard deviation of 1.00°C. Find the probability that a randomly selected thermometer reads between - 1.62 and - 0.91 and draw a sketch of the region. Click to view page 1 of the table. Click to view page 2 of the table. Sketch the region. Choose the correct graph below. O A. OB. Oc. The probability is Click to select your answer(s). Find the indicated...
Assume that thermometer readings are normally distributed with a mean of 0degrees°C and a standard deviation...
Assume that thermometer readings are normally distributed with a mean of 0degrees°C and a standard deviation of 1.00degrees°C. A thermometer is randomly selected and tested. For the case below, draw a sketch, and find the probability of the reading. (The given values are in Celsius degrees.) Between 0.500.50 and 1.50 The probability of getting a reading between 0.500.50degrees°C and 1.501.50degrees°C is?
Assume the readings on thermometers are normally distributed with a mean of OC and a standard...
 Assume the readings on thermometers are normally distributed with a mean of OC and a standard deviation of 1.00°C. Find the probability that a randomly selected thermometer reads greater than 0.24 and draw a sketch of the region. Click to view of the table. Click to view page 2 of the table ОА The probability is
Assume that thermometer readings are normally distributed with a mean of 0 degrees °C and a...
Assume that thermometer readings are normally distributed with a mean of 0 degrees °C and a standard deviation of 1.00 degrees °C. A thermometer is randomly selected and tested. For the case below, draw a sketch, and find the probability of the reading. (The given values are in Celsius degrees.) Between 0.25 and 1.75
5. Assume the readings on thermometers are normally distributed with a mean of 0°C and a...
5. Assume the readings on thermometers are normally distributed with a mean of 0°C and a standard deviation of 1.00°C. Find the probability that a randomly selected thermometer reads between −2.26 and −1.53 and draw a sketch of the region. 6. Assume that a randomly selected subject is given a bone density test. Those test scores are normally distributed with a mean of 0 and a standard deviation of 1. Draw a graph and find the probability of a bone...
Assume that the readings on the thermometers are normally distributed with a mean of 0° and standard deviation of 1.00°C
 Assume that the readings on the thermometers are normally distributed with a mean of 0° and standard deviation of 1.00°C. A thermometer is randomly selected and tested Draw a sketch and find the temperature reading corresponding to the 88th percentile. This is the temperature reading separating the bottom 88% from the top 12%.Which graph represents Psa? Choose the correct graph below The temperature for Pas is approximately _______ (Round to two decimal places as needed)
Assigned Media Question Help O Assume that thermometer readings are normally distributed with a mean of...
 Assigned Media Question Help O Assume that thermometer readings are normally distributed with a mean of OC and a stardid deviation of 100°C. A thermometer is randomly selected and tested for the case below, dwa sketch and find the probability of the reading (The given values are in Celsius degrees.) Between 150 and 225 Click to view.ge 1 of the table. Click to view.ge 2 of the table s A 2-150 150-25 The probability of getting a reading between 1.50*C...
 Assume that thermometer readings are normally distributed with a mean of O'C and a standard deviation of 1.00°C. A thermometer is randomly selected and tested For the case below, draw a sketch, and find the probability of the reading (The given values are in Celsius kres.) Between 0.75 and 1.50 Click to view page 1 of the table. Click to view page 2 of the table Draiv a sketch. Choose the correct graph belon ОА. -0.75 -1.50
 Assume that thermometer readings are normally distributed with a mean of O'C and a standard deviation of 1.00'C. A thermometer in randomly selected and tested. For the case below. draw a sketch, and find the probability of the reading. (The given values are in Celsius degrees.) Between 0.75 and 1.75 Click to view page 1 of the table. Click to view page 2 of the table. ОА. OB GO The probability of getting a reading between 0.75°C and 1.75°C is...
 Assume that thermometer readings are normally distributed with a mean of o°C and a standard deviation of 1.00°c. A thermometer is randomly selected and tested. For the case below, draw a sketch, and find the probability of the reading. (The given values are in Celsius degrees.) Between 0.25 and 1.25 Click to view page 1 of the table, Click to view page 2 of the table Draw a sketch. Choose the correct graph below A. Ов. Ос. z 0.25 1.25...
 Assume the readings on thermometers are normally distributed with a mean of 0°C and a standard deviation of 1.00°C. Find the probability that a randomly selected thermometer reads between - 1.62 and - 0.91 and draw a sketch of the region. Click to view page 1 of the table. Click to view page 2 of the table. Sketch the region. Choose the correct graph below. O A. OB. Oc. The probability is Click to select your answer(s). Find the indicated...
 Assume the readings on thermometers are normally distributed with a mean of OC and a standard deviation of 1.00°C. Find the probability that a randomly selected thermometer reads greater than 0.24 and draw a sketch of the region. Click to view of the table. Click to view page 2 of the table ОА The probability is
 Assigned Media Question Help O Assume that thermometer readings are normally distributed with a mean of OC and a stardid deviation of 100°C. A thermometer is randomly selected and tested for the case below, dwa sketch and find the probability of the reading (The given values are in Celsius degrees.) Between 150 and 225 Click to view.ge 1 of the table. Click to view.ge 2 of the table s A 2-150 150-25 The probability of getting a reading between 1.50*C...
Most questions answered within 3 hours.
-
Write a program to solve the Josephus problem, with the following
modification:
Sample Input:
./a.out n...
asked 40 minutes ago -
At the start of a CD it is spinning at a rate of 525 rpm
(revolutions...
asked 1 hour ago -
4. Without doing any calculations, predict whether the observed
∆T would increase, decrease or remain the...
asked 2 hours ago -
Based on the range, which of the following sets of scores has
the greatest variability? 3,...
asked 3 hours ago -
Ripples in a pond travel at a velocity of 3 m/s with one peak
passing a...
asked 3 hours ago -
A man stands on the roof of a building of height 13.0 mm and
throws a...
asked 3 hours ago -
The extent to which assets are financed by borrowed funds and
other liabilities is indicated by:...
asked 4 hours ago -
Explain in detail
Germany is the fifth largest economy
explain what goods and services Germany specializes...
asked 4 hours ago -
The density of platinum is 21.45 g/mL. If a cube of platinum
with a mass of...
asked 4 hours ago -
Accounts Receivable
Sales
A/R Posting
Extended Sales Invoice
Packing Slip
Compare invoice to packing slip 2...
asked 4 hours ago -
Michaella, age 23, is a full-time law student and is claimed by
her parents as a...
asked 5 hours ago -
Why are polymers not typically casted into products?
asked 5 hours ago