The table below represents the output and cost structure for a
firm. The market is perfectly competitive, and the market price is
$10. Total costs include all implicit opportunity costs. 
- Calculate the firm’s profit at each rate of output and fill in the values in the table.
- Calculate firm's marginal cost and marginal revenue at each rate of output and fill in the values in the table.
- Calculate the firm’s average total costs and average variable costs at each rate of output and fill in the values in the table.
- Based on the information in the table above, plot marginal cost (MC) at each rate of output. Properly label this line.
- Based on the information in the table above, plot marginal revenue (MR) at each rate of output. Properly label each line.
- Based on the information in the table above, plot average total costs (ATC) and average variable costs at each rate of output. Properly label each line.
- Highlight in yellow the short-run supply curve for this perfectly competitive firm.
- Based on marginal analysis, what is the profit-maximizing rate of output for the firm?
Homework Answers
Answer
When output(Q) is '0' , firm's total cost(TC) = 3 .
The firm's
fixed cost (FC) = 3
Now, Total cost = Fixed cost + Variable cost(VC)
Or, VC = TC - FC
The firm's
VC = TC - 3 , for each level of output, and associated TC.
Average total cost(ATC) = TC / Q
Average variable cost (AVC) = VC / Q
Marginal Cost (MC) is the change in TC due to change in one additional level of output(Q).
MC = d(TC) /
dQ
Marginal revenue(MR) is the change in total revenue(TR) due to change in one additional unit of output.
MR = d(TR) /
dQ
Profit = TR - TC
Now, calculating all the values, and putting them in the table;
| Output(Q) | Total Cost(TC) | Total Revenue(TR) | Profit | Marginal Cost(MC) | Marginal Revenue(MR) | Average Total Cost(ATC) | Variable Cost(VC) | Average Variable Cost(AVC) |
| 0 | 3 | 0 | -3 | xxx | xxx | - | - | - |
| 1 | 7 | 10 | 3 | 4 | 10 | 7 | 4 | 4 |
| 2 | 9 | 20 | 11 | 2 | 10 | 4.5 | 6 | 3 |
| 3 | 10 | 30 | 20 | 1 | 10 | 3.3 | 7 | 2.3 |
| 4 | 12 | 40 | 28 | 2 | 10 | 3 | 9 | 2.25 |
| 5 | 16 | 50 | 34 | 4 | 10 | 3.2 | 13 | 2.6 |
| 6 | 22 | 60 | 38 | 6 | 10 | 3.7 | 19 | 3.17 |
| 7 | 30 | 70 | 40 | 8 | 10 | 4.3 | 27 | 3.86 |
| 8 | 40 | 80 | 40 | 10 | 10 | 5 | 37 | 4.63 |
| 9 | 52 | 90 | 38 | 12 | 10 | 5.8 | 49 | 5.44 |
| 10 | 68 | 100 | 32 | 16 | 10 | 6.8 | 65 | 6.5 |
_________________________________________________________________________
Based on the information in the table above, the marginal cost (MC), and marginal revenue(MR) curves at each rate of output are shown in the figure below;
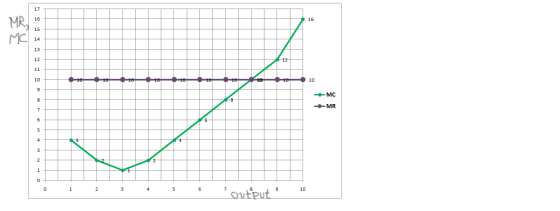
In the above figure, we are measuring output on the horizontal axis, and 'MR', and 'MC' on the vertical axis. The green curve is the 'MC' curve, and the purple line shows the 'MR'.
_________________________________________________________________________________________
Based on the information in the table above, the average total costs (ATC) and average variable costs(AVC) at each rate of output are shown in the figure below;
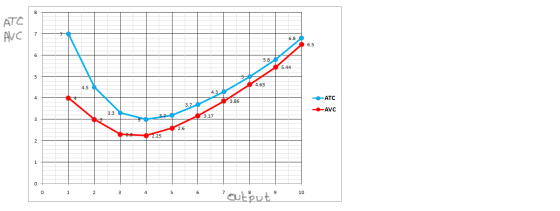
In the above figure, we are measuring output on the horizontal axis, and 'ATC', and 'AVC' on the vertical axis. The blue curve is the ATC curve, and the red curve is the AVC curve.
_______________________________________________________________________________________
The short-run supply curve for this perfectly competitive firm is shown in the following figure;
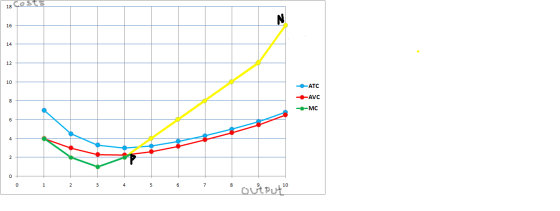
In the short-run, a perfectly competitive firm supplies the output, for which the marginal cost(MC) is equal to or above the minimum point of average variable cost(AVC). So the upward portion of the MC curve, which is above the AVC curve, is the short-run supply curve of a perfectly competitive firm. In the above figure, the yellow portion of the MC curve, is the firm's supply curve. So here, the firm's supply curve is 'PN' part of MC curve. Point 'P' is the minimum point of AVC curve.
______________________________________________________________________________
Based on the marginal analysis, the perfectly competitive firm produces the profit-maximizing level of output, where MR = MC.From the table, we see that at 8 units of output, the firm's MC = MR = 10.
So the firm's profit- maximizing rate of output is 8 units.
___________________________________________________________________
Add Answer to:
The table below represents the output and cost structure for a
firm. The market is perfectly...
The table below represents the output and cost structure for a firm. The market is perfectly...
 The table below represents the output and cost structure for a firm. The market is perfectly competitive, and the market price is $10. Total costs include all implicit opportunity costs. Total Cost Marginal Marginal Cost Revenue Total Revenue 0 Average Total Cost Average Variable Cost Output 0 Profit 3 XXX XXX 1 2 7 9 10 10 20 30 3 4 12 40 5 16 50 6 22 60 7 30 70 8 40 80 90 9 52 10 68...
The table below represents the output and cost structure for a firm. The market is perfectly...
The table below represents the output and cost structure for a firm. The market is perfectly competitive, and the market price is $10. Total costs include all implicit opportunity costs. Output Total Cost Total Revenue Profit Marginal Cost Marginal Revenue Averrage Total Cost Average Variable Cost 0 3 0 1 7 10 2 9 20 3 10 30 4 12 40 5 16 50 6 22 60 7 30 70 8 40 80 9 52 90 10 68 100 ...
Plz help me fill the the AVC row in this chart. also can you tell me...
 Plz help me fill the the AVC row in this chart. also can you
tell me what’s suppose to be hightlighted for question 7? And
explain question 8 to me?
The talde below represents the output and cost structure for a tim. The market is perfectly petitive, and the market price is $10. Total costs include all implicit opportunity costs y Marginal Maral Cost Revenue Total Average Total Cost Average Variable Cost een Profi 1. Calculate the firm's profit at...
Plz help me fill the the AVC row in this chart. also can you
tell me what’s suppose to be hightlighted for question 7? And
explain question 8 to me?
The talde below represents the output and cost structure for a tim. The market is perfectly petitive, and the market price is $10. Total costs include all implicit opportunity costs y Marginal Maral Cost Revenue Total Average Total Cost Average Variable Cost een Profi 1. Calculate the firm's profit at...
The table below represents the hourly output and cost structure for a local pizza shop. The...
 The table below represents the hourly output and cost structure for a local pizza shop. The market is perfectly competitive, and the market price of a pizza in the area is $10. Total costs include all implicit opportunity costs. Marginal Calculate the pizza shop's marginal cost and marginal revenue at each rate of output and fill in the values in the table Total Economic Marginal Total Hourly Cost (S) Total Revenue (S) Cost () Revenue (S) Total Hourly Output and...
The table below represents the hourly output and cost structure for a local pizza shop. The...
 The table below represents the hourly output and cost structure for a local pizza shop. The market is perfectly compettive, and the market price of a pizza in the area is $10. Total costs include all implicit opportunity costs. Calculate the pizza shop's marginal cost and marginal revenue each rate of output and ill in the values in the table. Total Hourly Output Tetal Hourty Tetal Total Economic Marginal Marginal and Sales of Pizzas Cost) Reven(Profit ( Cost (3) Revenue...
he table below represents the hourly output and cost structure for a local pizza shop. The...
he table below represents the hourly output and cost structure for a local pizza shop. The market is perfectly competitve, and the market price of a pizza in this area is $12. Total cost include all implicit opportunity cost. Calculate the pizza shop's marginal cost and marginal revenue at each rate of output and fill in the values in the table. Total Hourly Output and Sales of Pizzas Total Hourly Cost ($) Total Revenue ($) Total Economic Profit ($) Marginal...
1. Under the perfectly competitive market structure, the demand curve of an individual firm is [ Select...
1. Under the perfectly competitive market structure, the demand curve of an individual firm is [ Select ] ["downward sloping", "unit-elastic", "perfectly inelastic", "perfectly elastic"] meaning that the demand curve is also the [ Select ] ["Marginal Cost curve", "average cost", "marginal revenue = Marginal costs", "marginal revenue curve"] 2. With a perfectly competitive firm the supply curve is: a) Marginal Product b) the marginal cost curve above the Average fixed Cost curve c) it has...
1. What type of demand curve does a perfectly competitive firm face? Why? 2. A perfectly...
1. What type of demand curve does a perfectly competitive firm face? Why? 2. A perfectly competitive firm has the following fixed and variable costs in the short run. The market price for the firm’s product is $150. Output FC VC TC TR Profit/Loss 0 $100 $ 0 ___ ___ ___ 1 100 100 ___ ___ ___ 2 100 180 ___ ___ ___ 3 100 ...
The graph presents the costs and revenue for a perfectly (purely) competitive firm, where the market...
 The graph presents the costs and revenue for a perfectly (purely) competitive firm, where the market price is equal to $600 per unit of output. This firm has a fixed cost equal to $3,600. Use this information to determine the optimal output and profit for this firm. What is the optimal output of this perfectly (purely) competitive firm? (Round your answer to the nearest whole number.) Cost and revenue $2400 2200 2000 1800 Average 1600 total cost Marginal cost Average...
15. Use the following figure for a firm in a perfectly competitive market. a What is the output that maximizes...
 15. Use the following figure for a firm in a perfectly competitive market. a What is the output that maximizes the firm's profit? b. At the profit-maximizing output, calculate total revenue and total cost. C. If the firm maximizes profit, how much profit does it earn? d. What will likely happen to market demand or market supply in the long run? e. What will likely happen to the market price in the long run? Price (s) d = P =...
 The table below represents the output and cost structure for a firm. The market is perfectly competitive, and the market price is $10. Total costs include all implicit opportunity costs. Total Cost Marginal Marginal Cost Revenue Total Revenue 0 Average Total Cost Average Variable Cost Output 0 Profit 3 XXX XXX 1 2 7 9 10 10 20 30 3 4 12 40 5 16 50 6 22 60 7 30 70 8 40 80 90 9 52 10 68...
 Plz help me fill the the AVC row in this chart. also can you
tell me what’s suppose to be hightlighted for question 7? And
explain question 8 to me?
The talde below represents the output and cost structure for a tim. The market is perfectly petitive, and the market price is $10. Total costs include all implicit opportunity costs y Marginal Maral Cost Revenue Total Average Total Cost Average Variable Cost een Profi 1. Calculate the firm's profit at...
Plz help me fill the the AVC row in this chart. also can you
tell me what’s suppose to be hightlighted for question 7? And
explain question 8 to me?
The talde below represents the output and cost structure for a tim. The market is perfectly petitive, and the market price is $10. Total costs include all implicit opportunity costs y Marginal Maral Cost Revenue Total Average Total Cost Average Variable Cost een Profi 1. Calculate the firm's profit at...
 The table below represents the hourly output and cost structure for a local pizza shop. The market is perfectly competitive, and the market price of a pizza in the area is $10. Total costs include all implicit opportunity costs. Marginal Calculate the pizza shop's marginal cost and marginal revenue at each rate of output and fill in the values in the table Total Economic Marginal Total Hourly Cost (S) Total Revenue (S) Cost () Revenue (S) Total Hourly Output and...
 The table below represents the hourly output and cost structure for a local pizza shop. The market is perfectly compettive, and the market price of a pizza in the area is $10. Total costs include all implicit opportunity costs. Calculate the pizza shop's marginal cost and marginal revenue each rate of output and ill in the values in the table. Total Hourly Output Tetal Hourty Tetal Total Economic Marginal Marginal and Sales of Pizzas Cost) Reven(Profit ( Cost (3) Revenue...
 The graph presents the costs and revenue for a perfectly (purely) competitive firm, where the market price is equal to $600 per unit of output. This firm has a fixed cost equal to $3,600. Use this information to determine the optimal output and profit for this firm. What is the optimal output of this perfectly (purely) competitive firm? (Round your answer to the nearest whole number.) Cost and revenue $2400 2200 2000 1800 Average 1600 total cost Marginal cost Average...
 15. Use the following figure for a firm in a perfectly competitive market. a What is the output that maximizes the firm's profit? b. At the profit-maximizing output, calculate total revenue and total cost. C. If the firm maximizes profit, how much profit does it earn? d. What will likely happen to market demand or market supply in the long run? e. What will likely happen to the market price in the long run? Price (s) d = P =...
Most questions answered within 3 hours.
-
Your friend tells you that there is a vending machine on campus
that dispenses M&M packs...
asked 7 minutes ago -
What advantages are there to using piperidine rather than
hydroxide as a base?
asked 5 minutes ago -
7. The life of a Freeze Breeze electric fan is normally
distributed with a mean 4...
asked 9 minutes ago -
1. A 751 mL NaCl solution is diluted to a volume of 1.06 L and a...
asked 13 minutes ago -
8
A $20,000 face value STRIPS is currently quoted at 38.642 and
has 8 years to...
asked 14 minutes ago -
The current exchange rate between the Japanese yen and
the US dollar is 120 yen per...
asked 16 minutes ago -
Marla’s Massages and More bought a special massage table two
years ago for $9,300. At the...
asked 23 minutes ago -
Suppose you require a peak output voltage of 15.0 V and have
available an AC source...
asked 23 minutes ago -
We
conduct A study to estimate the mean age of the population of women
at the...
asked 35 minutes ago -
.13 : Assume that we make an enhancement to a computer that
improves some mode of...
asked 36 minutes ago -
4)
Find the tension in an elevator cable if the 1000 kg elevator is
descending with...
asked 42 minutes ago -
A random sample of 51 newborn babies was taken at the Hospital.
The sample mean was...
asked 40 minutes ago