The table below represents the output and cost structure for a firm. The market is perfectly...
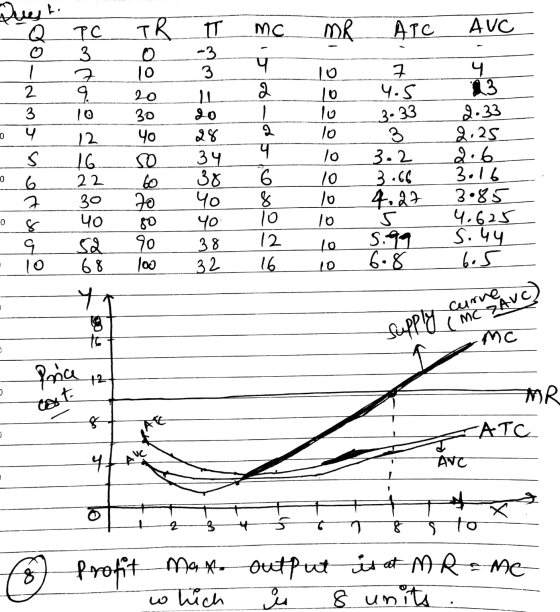
The table below represents the output and cost structure for a firm. The market is perfectly competitive, and the market price is $10. Total costs include all implicit opportunity costs.
| Output | Total Cost | Total Revenue | Profit | Marginal Cost | Marginal Revenue | Averrage Total Cost | Average Variable Cost |
| 0 | 3 | 0 | |||||
| 1 | 7 | 10 | |||||
| 2 | 9 | 20 | |||||
| 3 | 10 | 30 | |||||
| 4 | 12 | 40 | |||||
| 5 | 16 | 50 | |||||
| 6 | 22 | 60 | |||||
| 7 | 30 | 70 | |||||
| 8 | 40 | 80 | |||||
| 9 | 52 | 90 |
| 10 | 68 | 100 |
1. Calculate the firm’s profit at each rate of output and fill in the values in the table.
2. Calculate firm's marginal cost and marginal revenue at each rate of output and fill in the values in the table.
3. Calculate the firm’s average total costs and average variable costs at each rate of output and fill in the values in the table.
4. Based on the information in the table above, plot marginal cost (MC) at each rate of output. Properly label this line.
5. Based on the information in the table above, plot marginal revenue (MR) at each rate of output. Properly label each line.
6. Based on the information in the table above, plot average total costs (ATC) and average variable costs at each rate of output. Properly label each line.
7. Highlight in yellow the short-run supply curve for this perfectly competitive firm.
8. Based on marginal analysis, what is the profit-maximizing rate of output for the firm?
Homework Answers
Add Answer to:
The table below represents the output and cost structure for a
firm. The market is perfectly...
The table below represents the output and cost structure for a firm. The market is perfectly...
 The table below represents the output and cost structure for a
firm. The market is perfectly competitive, and the market price is
$10. Total costs include all implicit opportunity costs.
Calculate the firm’s profit at each rate of output and fill in
the values in the table.
Calculate firm's marginal cost and marginal revenue at each
rate of output and fill in the values in the table.
Calculate the firm’s average total costs and average variable
costs at each rate...
The table below represents the output and cost structure for a
firm. The market is perfectly competitive, and the market price is
$10. Total costs include all implicit opportunity costs.
Calculate the firm’s profit at each rate of output and fill in
the values in the table.
Calculate firm's marginal cost and marginal revenue at each
rate of output and fill in the values in the table.
Calculate the firm’s average total costs and average variable
costs at each rate...
The table below represents the output and cost structure for a firm. The market is perfectly...
 The table below represents the output and cost structure for a firm. The market is perfectly competitive, and the market price is $10. Total costs include all implicit opportunity costs. Total Cost Marginal Marginal Cost Revenue Total Revenue 0 Average Total Cost Average Variable Cost Output 0 Profit 3 XXX XXX 1 2 7 9 10 10 20 30 3 4 12 40 5 16 50 6 22 60 7 30 70 8 40 80 90 9 52 10 68...
Plz help me fill the the AVC row in this chart. also can you tell me...
 Plz help me fill the the AVC row in this chart. also can you
tell me what’s suppose to be hightlighted for question 7? And
explain question 8 to me?
The talde below represents the output and cost structure for a tim. The market is perfectly petitive, and the market price is $10. Total costs include all implicit opportunity costs y Marginal Maral Cost Revenue Total Average Total Cost Average Variable Cost een Profi 1. Calculate the firm's profit at...
Plz help me fill the the AVC row in this chart. also can you
tell me what’s suppose to be hightlighted for question 7? And
explain question 8 to me?
The talde below represents the output and cost structure for a tim. The market is perfectly petitive, and the market price is $10. Total costs include all implicit opportunity costs y Marginal Maral Cost Revenue Total Average Total Cost Average Variable Cost een Profi 1. Calculate the firm's profit at...
The table below represents the hourly output and cost structure for a local pizza shop. The...
 The table below represents the hourly output and cost structure for a local pizza shop. The market is perfectly competitive, and the market price of a pizza in the area is $10. Total costs include all implicit opportunity costs. Marginal Calculate the pizza shop's marginal cost and marginal revenue at each rate of output and fill in the values in the table Total Economic Marginal Total Hourly Cost (S) Total Revenue (S) Cost () Revenue (S) Total Hourly Output and...
The table below represents the hourly output and cost structure for a local pizza shop. The...
 The table below represents the hourly output and cost structure for a local pizza shop. The market is perfectly compettive, and the market price of a pizza in the area is $10. Total costs include all implicit opportunity costs. Calculate the pizza shop's marginal cost and marginal revenue each rate of output and ill in the values in the table. Total Hourly Output Tetal Hourty Tetal Total Economic Marginal Marginal and Sales of Pizzas Cost) Reven(Profit ( Cost (3) Revenue...
1. What type of demand curve does a perfectly competitive firm face? Why? 2. A perfectly...
1. What type of demand curve does a perfectly competitive firm face? Why? 2. A perfectly competitive firm has the following fixed and variable costs in the short run. The market price for the firm’s product is $150. Output FC VC TC TR Profit/Loss 0 $100 $ 0 ___ ___ ___ 1 100 100 ___ ___ ___ 2 100 180 ___ ___ ___ 3 100 ...
he table below represents the hourly output and cost structure for a local pizza shop. The...
he table below represents the hourly output and cost structure for a local pizza shop. The market is perfectly competitve, and the market price of a pizza in this area is $12. Total cost include all implicit opportunity cost. Calculate the pizza shop's marginal cost and marginal revenue at each rate of output and fill in the values in the table. Total Hourly Output and Sales of Pizzas Total Hourly Cost ($) Total Revenue ($) Total Economic Profit ($) Marginal...
The graph presents the costs and revenue for a perfectly (purely) competitive firm, where the market...
 The graph presents the costs and revenue for a perfectly (purely) competitive firm, where the market price is equal to $600 per unit of output. This firm has a fixed cost equal to $3,600. Use this information to determine the optimal output and profit for this firm. What is the optimal output of this perfectly (purely) competitive firm? (Round your answer to the nearest whole number.) Cost and revenue $2400 2200 2000 1800 Average 1600 total cost Marginal cost Average...
1. Under the perfectly competitive market structure, the demand curve of an individual firm is [ Select...
1. Under the perfectly competitive market structure, the demand curve of an individual firm is [ Select ] ["downward sloping", "unit-elastic", "perfectly inelastic", "perfectly elastic"] meaning that the demand curve is also the [ Select ] ["Marginal Cost curve", "average cost", "marginal revenue = Marginal costs", "marginal revenue curve"] 2. With a perfectly competitive firm the supply curve is: a) Marginal Product b) the marginal cost curve above the Average fixed Cost curve c) it has...
Part III. Graphing the perfectly competitive model (20 points). Use one graphing paper only for the graph. Attach the...
 Part III. Graphing the perfectly competitive model (20 points). Use one graphing paper only for the graph. Attach the graphing paper with this completed questionnaire upon submission. All answers should be handwritten. Given: Selling price P=60 Total cost TC = 128 +69 Q-14 Q2 +Q? 1. Average cost equation AC= 2. Marginal cost equation MC = 3. Fill in the blanks in the table. You should be able to show that at the optimum rate of output, Q*, the profit...
 The table below represents the output and cost structure for a
firm. The market is perfectly competitive, and the market price is
$10. Total costs include all implicit opportunity costs.
Calculate the firm’s profit at each rate of output and fill in
the values in the table.
Calculate firm's marginal cost and marginal revenue at each
rate of output and fill in the values in the table.
Calculate the firm’s average total costs and average variable
costs at each rate...
The table below represents the output and cost structure for a
firm. The market is perfectly competitive, and the market price is
$10. Total costs include all implicit opportunity costs.
Calculate the firm’s profit at each rate of output and fill in
the values in the table.
Calculate firm's marginal cost and marginal revenue at each
rate of output and fill in the values in the table.
Calculate the firm’s average total costs and average variable
costs at each rate...
 The table below represents the output and cost structure for a firm. The market is perfectly competitive, and the market price is $10. Total costs include all implicit opportunity costs. Total Cost Marginal Marginal Cost Revenue Total Revenue 0 Average Total Cost Average Variable Cost Output 0 Profit 3 XXX XXX 1 2 7 9 10 10 20 30 3 4 12 40 5 16 50 6 22 60 7 30 70 8 40 80 90 9 52 10 68...
 Plz help me fill the the AVC row in this chart. also can you
tell me what’s suppose to be hightlighted for question 7? And
explain question 8 to me?
The talde below represents the output and cost structure for a tim. The market is perfectly petitive, and the market price is $10. Total costs include all implicit opportunity costs y Marginal Maral Cost Revenue Total Average Total Cost Average Variable Cost een Profi 1. Calculate the firm's profit at...
Plz help me fill the the AVC row in this chart. also can you
tell me what’s suppose to be hightlighted for question 7? And
explain question 8 to me?
The talde below represents the output and cost structure for a tim. The market is perfectly petitive, and the market price is $10. Total costs include all implicit opportunity costs y Marginal Maral Cost Revenue Total Average Total Cost Average Variable Cost een Profi 1. Calculate the firm's profit at...
 The table below represents the hourly output and cost structure for a local pizza shop. The market is perfectly competitive, and the market price of a pizza in the area is $10. Total costs include all implicit opportunity costs. Marginal Calculate the pizza shop's marginal cost and marginal revenue at each rate of output and fill in the values in the table Total Economic Marginal Total Hourly Cost (S) Total Revenue (S) Cost () Revenue (S) Total Hourly Output and...
 The table below represents the hourly output and cost structure for a local pizza shop. The market is perfectly compettive, and the market price of a pizza in the area is $10. Total costs include all implicit opportunity costs. Calculate the pizza shop's marginal cost and marginal revenue each rate of output and ill in the values in the table. Total Hourly Output Tetal Hourty Tetal Total Economic Marginal Marginal and Sales of Pizzas Cost) Reven(Profit ( Cost (3) Revenue...
 The graph presents the costs and revenue for a perfectly (purely) competitive firm, where the market price is equal to $600 per unit of output. This firm has a fixed cost equal to $3,600. Use this information to determine the optimal output and profit for this firm. What is the optimal output of this perfectly (purely) competitive firm? (Round your answer to the nearest whole number.) Cost and revenue $2400 2200 2000 1800 Average 1600 total cost Marginal cost Average...
 Part III. Graphing the perfectly competitive model (20 points). Use one graphing paper only for the graph. Attach the graphing paper with this completed questionnaire upon submission. All answers should be handwritten. Given: Selling price P=60 Total cost TC = 128 +69 Q-14 Q2 +Q? 1. Average cost equation AC= 2. Marginal cost equation MC = 3. Fill in the blanks in the table. You should be able to show that at the optimum rate of output, Q*, the profit...
Most questions answered within 3 hours.
-
Two small plastic spheres are given positive electrical charges.
When they are a distance of 15.4...
asked 40 minutes ago -
how
does gravity affect the trajectory of projectile? what would be the
shape of the trajactory...
asked 32 minutes ago -
An acidic solution containing gold ions is
electrolyzed, producing gaseous oxygen (from water) at the anode...
asked 55 minutes ago -
Assume that the population of Mexico is 128
million and that the population increases 1.01
percentannually....
asked 1 hour ago -
Can someone please help me add appropriate descriptive
comments to each line of code in the...
asked 1 hour ago -
Romeo wishes to throw a bouquet of flowers to Juliet, who is on
a second-story balcony,...
asked 2 hours ago -
Why is QE a controversial monetary policy tool.
A. It may lead to excessive inflation.B. By...
asked 3 hours ago -
Principles of Programming midterm study guide help!
1.)
______ Which of the following would reference the...
asked 2 hours ago -
A finite potential well has depth U0 = 2.78 eV . What is the
penetration distance...
asked 3 hours ago -
1. The bus bars of a power station are in two sections A and B
separated...
asked 3 hours ago -
Fiscal policy is the deliberate manipulation of taxes and
government spending to alter GDP, employment, inflation...
asked 4 hours ago -
evaluating an expression using only one digit and + and - as
operators ....3+5-1+7-5+8
-----------------------
stack...
asked 4 hours ago