
Homework Answers
First find the mean of X and Y & regression coefficient
then find the regression equation

Add Answer to:
For the data set below (a) Determine the least-squares regression line. (b) Graph the least-squares regression...
For the data set below, (a) Determine the least-squares regression line. (b) Graph the least-squares regression...
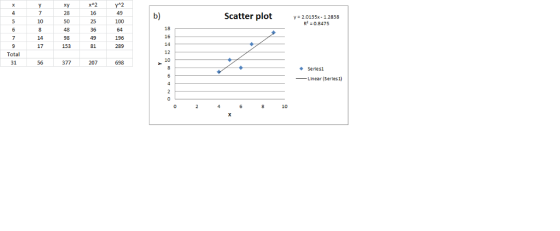
 For the data set below, (a) Determine the least-squares regression line. (b) Graph the least-squares regression line on the scatter diagram. 6 7 y 7 10 8 14 17 (a) Determine the least-squares regression line. (Round to four decimal places as needed.)
For the data set below (a) Determine the least-squares regression line. (b) Compute the sum of...
 For the data set below (a) Determine the least-squares regression line. (b) Compute the sum of the squared residuals for the least-squares regression line. x 30 40 50 60 70 y 80 73 64 48 43 (a) Determine the least-squares regression line. ỳ-Ux + ] (Round to four decimal places as needed.) (b) The sum of the squared residuals is (Round to two decimal places as needed.)
For the data set below, (a) Determine the least-squares regression line. (b) Compute the sum of...
For the data set below, (a) Determine the least-squares regression line. (b) Compute the sum of the squared residuals for the least-squares regression line. x 10 20 30 40 50 y 150 131 135 120 119 (a) Determine the least-squares regression line. ModifyingAbove y with caretyequals=nothingxplus+nothing (Round to four decimal places as needed.)
For the data set below (a) Determine the least-squares regression line. (b) Compute th x30405060 70...
 For the data set below (a) Determine the least-squares regression line. (b) Compute th x30405060 70 y 113 100 87 85 67 (a) Determine the least-squares regression line (Round to four decimal places as needed)
Next Question Question Help The scatter diagram for the data set below is shown. (a) Determine...
 Next Question Question Help The scatter diagram for the data set below is shown. (a) Determine the least-squares regression line. (b) Graph the least-squares regression line on the scatter diagram. X y 0 7.1 0 5.8 7 5.2 4.8 3.7 Pra (a) 9 = x+ (Round to three decimal places as needed.) (b) Choose the correct graph of the least-squares regression line below. Mic OB Ос. Q Pra 1 X Fir SG Click to select your answer(s).
A data set is given below. (a) Draw a scatter diagram. Comment on the type of...
 A data set is given below. (a) Draw a scatter diagram. Comment on the type of relation that appears to exist between x and y (b) Given that x = 3.5000, -2.3452, y = 4.2000, - 1.6625, and r = -0.9387, determine the least squares regression line. (c) Graph the least squares regression line on the scatter diagram drawn in part(a) 0 2 3 4 6 6 5.8 5.8 5.3 3.7 22 2.4 (a) Choose the correct graph below. There...
A data set is given below. (a) Draw a scatter diagram. Comment on the type of...
 A data set is given below. (a) Draw a scatter diagram. Comment on the type of relation that appears to exist between x and y (b) Given that x = 3.5000, 5x = 2.2583, y = 3.8667, 5y = 1.8822, and r= -0.9552, determine the least-squares regression line (c) Graph the least-squares regression line on the scatter diagram drawn in part (a). 1 1 3 4 6 6 5.0 6.4 4.9 3.3 1.6 2.0 у (a) Choose the correct graph...
Compute the least-squares regression equation for the given data set. Round the slope and y-intercept to...
 Compute the least-squares regression equation for the given data set. Round the slope and y-intercept to at least four decimal places. х 3 7 5 4 y اقتها 1 6 4 5 Send data alle Regression line equation: y
6) Compute the least-squares regression line for predicting y from x given the following summary statistics....
6) Compute the least-squares regression line for predicting y from x given the following summary statistics. Round the slope and y -intercept to at least four decimal places. = x 8.8 = s x 1.2 = y 30.4 = s y 16 = r 0.60 Send data to Excel Regression line equation: = y 7)Compute the least-squares regression equation for the given data set. Use a TI- 84 calculator. Round the slope and y -intercept to at least four decimal...
A data set is given below.
 A data set is given below.(a) Draw a scatter diagram. Comment on the type of relation that appears to exist between x and y.(b) Given that x̅=3.6667, sX=2.2509, y̅=3.8000, sy=1.8612, and r=-0.9548, determine the least-squares regression line.(c) Graph the least-squares regression line on the scatter diagram drawn in part (a).x114466y5.16.54.23.41.71.9a.b.
 For the data set below, (a) Determine the least-squares regression line. (b) Graph the least-squares regression line on the scatter diagram. 6 7 y 7 10 8 14 17 (a) Determine the least-squares regression line. (Round to four decimal places as needed.)
 For the data set below (a) Determine the least-squares regression line. (b) Compute the sum of the squared residuals for the least-squares regression line. x 30 40 50 60 70 y 80 73 64 48 43 (a) Determine the least-squares regression line. ỳ-Ux + ] (Round to four decimal places as needed.) (b) The sum of the squared residuals is (Round to two decimal places as needed.)
 For the data set below (a) Determine the least-squares regression line. (b) Compute th x30405060 70 y 113 100 87 85 67 (a) Determine the least-squares regression line (Round to four decimal places as needed)
 Next Question Question Help The scatter diagram for the data set below is shown. (a) Determine the least-squares regression line. (b) Graph the least-squares regression line on the scatter diagram. X y 0 7.1 0 5.8 7 5.2 4.8 3.7 Pra (a) 9 = x+ (Round to three decimal places as needed.) (b) Choose the correct graph of the least-squares regression line below. Mic OB Ос. Q Pra 1 X Fir SG Click to select your answer(s).
 A data set is given below. (a) Draw a scatter diagram. Comment on the type of relation that appears to exist between x and y (b) Given that x = 3.5000, -2.3452, y = 4.2000, - 1.6625, and r = -0.9387, determine the least squares regression line. (c) Graph the least squares regression line on the scatter diagram drawn in part(a) 0 2 3 4 6 6 5.8 5.8 5.3 3.7 22 2.4 (a) Choose the correct graph below. There...
 A data set is given below. (a) Draw a scatter diagram. Comment on the type of relation that appears to exist between x and y (b) Given that x = 3.5000, 5x = 2.2583, y = 3.8667, 5y = 1.8822, and r= -0.9552, determine the least-squares regression line (c) Graph the least-squares regression line on the scatter diagram drawn in part (a). 1 1 3 4 6 6 5.0 6.4 4.9 3.3 1.6 2.0 у (a) Choose the correct graph...
 Compute the least-squares regression equation for the given data set. Round the slope and y-intercept to at least four decimal places. х 3 7 5 4 y اقتها 1 6 4 5 Send data alle Regression line equation: y
 A data set is given below.(a) Draw a scatter diagram. Comment on the type of relation that appears to exist between x and y.(b) Given that x̅=3.6667, sX=2.2509, y̅=3.8000, sy=1.8612, and r=-0.9548, determine the least-squares regression line.(c) Graph the least-squares regression line on the scatter diagram drawn in part (a).x114466y5.16.54.23.41.71.9a.b.
Most questions answered within 3 hours.
-
3) What are the typical social structures in a global city?
asked 30 minutes ago -
Luther Corporation
Consolidated Balance Sheet
December 31, 2019 and 2018 (in $ millions)
Assets
2019
2018...
asked 32 minutes ago -
(Expected rate of return and risk) Carter Inc. is evaluating a
security. Calculate the investment’s expected...
asked 3 hours ago -
What specific indicators can point to lack of progress for
African Americans in American society?
asked 4 hours ago -
1-The Electrons in a beam are moving at 2.7×10⁸ m/s in an
electric field of 15000...
asked 4 hours ago -
A gas tank is a vertical cylinder. It has a radius of 1m, a
height of...
asked 4 hours ago -
Accent Software faces the following conditions. All of these
support Accent’s use of a market-penetration pricing...
asked 5 hours ago -
A mathematically inclined friend emails you the following
instructions: "Meet me in the cafeteria the first...
asked 5 hours ago -
A monopoly sells in two countries . The demand curves in the two
countries are p1...
asked 6 hours ago -
A .15kg rubber ball is bounced off a wall. Before hitting the
wall, the ball moves...
asked 7 hours ago -
A manufacturing company preparing to build a new plant is
considering three potential locations for it....
asked 7 hours ago -
B. If compound Y has approximately the same values of solubility
in toluene as compound X,...
asked 8 hours ago