
Homework Answers


Add Answer to:
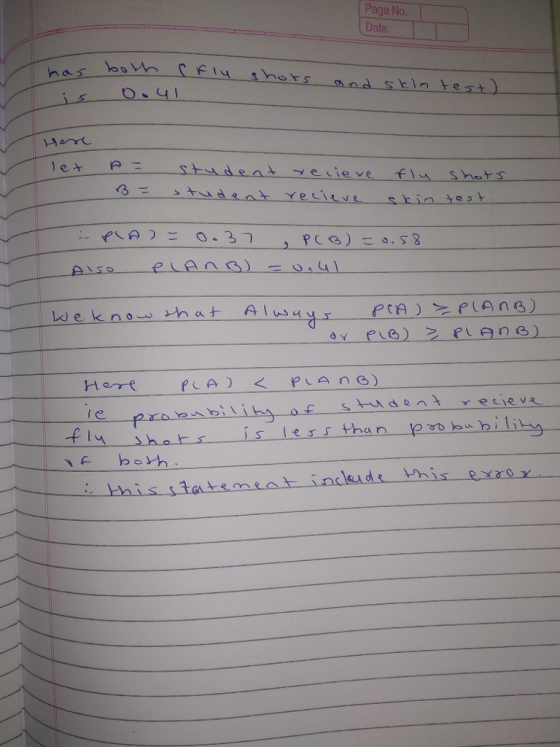
Find the errors in each of the following statements: a) The probabilities that a car salesman...
Computer upgrades have a nominal time of 80 minutes. Samples of five observations each have been ...
Computer upgrades have a nominal time of 80 minutes. Samples of five observations each have been taken, and the results are as listed. SAMPLE 1 2 3 4 5 6 79.2 80.5 79.6 78.9 80.5 79.7 78.8 78.7 79.6 79.4 79.6 80.6 80.0 81.0 80.4 79.7 80.4 80.5 78.4 80.4 80.3 79.4 80.8 80.0 81.0 80.1 80.8 80.6 78.8 81.1 Factors for three-sigma control limits for x¯ and R charts FACTORS FOR R CHARTS Number of Observations in Subgroup, n...
Use Table 8.1, a computer, or a calculator to answer the following. Suppose a candidate for...
 Use Table 8.1, a computer, or a calculator to answer the following. Suppose a candidate for public office is favored by only 47% of the voters. If a sample survey randomly selects 2,500 voters, the percentage in the sample who favor the candidate can be thought of as a measurement from a normal curve with a mean of 47% and a standard deviation of 1%. Based on this information, how often (as a %) would such a survey show that...
Q1. Find mean deviation from the mean of the following data. Size of the items ??...
Q1. Find mean deviation from the mean of the following data. Size of the items ?? 4 6 8 10 12 14 16 Frequency ?? 2 4 5 3 2 1 3 where mean is given 10 marks. Q2. The daily sale of chocolate in Othammarket given below: Monday Tuesday Wednesday Thursday Friday Saturday Sunday 140kg 50kg 60kg 70kg 80kg 90kg 100kg The average daily sale is 75kg. Calculate the variance and the standard deviation of the above data. Q3....
The following results were obtained from an undrained shear box test carried out on a set...
 The following results were obtained from an undrained shear box test carried out on a set of undisturbed soil samples. 0.2 0.8 Normal Load (N) Strain (%) 1 2 3 4 5 6 7 8 9 10 11 12 13 14 15 16 17 18 0 21 46 70 89 107 121 131 136 138 138 137 136 0.4 Shearing force (N) 0 33 72 110 139 164 180 192 201 210 217 224 230 234 237 236 0 45...
Suppose 1000 coins are tossed. Use the normal curve approximation to the binomial distribution to find...
 Suppose 1000 coins are tossed. Use the normal curve approximation to the binomial distribution to find the probability of getting the following result. Exactly 495 heads Use the table of areas under the standard normal curve given below. Click here to view page 1. Click here to view page 2. Click here to view page 3. Click here to view page 4. Click here to view page 5. Click here to view page 6. The probability of getting exactly 495...
Suppose 16 coins are tossed. Use the normal curve approximation to the binomial distribution to find...
 Suppose 16 coins are tossed. Use the normal curve approximation to the binomial distribution to find the probability of getting the following result. More than 11 tails. Use the table of areas under the standard normal curve given below. Click here to view page 1. Click here to view page 2. Click here to view page 3. Click here to view page 4. Click here to view page 5. Click here to view page 6. Binomial probability = (Round to...
A fnance executve would ike to determine if a relationship exists between the current earnings per share (EPS) of...
 A fnance executve would ike to determine if a relationship exists between the current earnings per share (EPS) of a bank and the total assets S billions), previous period's EPS, previous period's retun on average assets (ROAA), and the previous period's retun on average equity (ROAE) ROAA measures how effectively assets are utilized, and ROAE measures a firm's profitability. Complete parts a through d below EClick the icon to view the table of data. a. Construct a regression model using...
 Use Table 8.1, a computer, or a calculator to answer the following. Suppose a candidate for public office is favored by only 47% of the voters. If a sample survey randomly selects 2,500 voters, the percentage in the sample who favor the candidate can be thought of as a measurement from a normal curve with a mean of 47% and a standard deviation of 1%. Based on this information, how often (as a %) would such a survey show that...
 The following results were obtained from an undrained shear box test carried out on a set of undisturbed soil samples. 0.2 0.8 Normal Load (N) Strain (%) 1 2 3 4 5 6 7 8 9 10 11 12 13 14 15 16 17 18 0 21 46 70 89 107 121 131 136 138 138 137 136 0.4 Shearing force (N) 0 33 72 110 139 164 180 192 201 210 217 224 230 234 237 236 0 45...
 The following results were obtained from an undrained shear box test carried out on a set of undisturbed soil samples. 0.2 0.8 Normal Load (N) Strain (%) 1 2 3 4 5 6 7 8 9 10 11 12 13 14 15 16 17 18 0 21 46 70 89 107 121 131 136 138 138 137 136 0.4 Shearing force (N) 0 33 72 110 139 164 180 192 201 210 217 224 230 234 237 236 0 45...
 Suppose 1000 coins are tossed. Use the normal curve approximation to the binomial distribution to find the probability of getting the following result. Exactly 495 heads Use the table of areas under the standard normal curve given below. Click here to view page 1. Click here to view page 2. Click here to view page 3. Click here to view page 4. Click here to view page 5. Click here to view page 6. The probability of getting exactly 495...
 Suppose 16 coins are tossed. Use the normal curve approximation to the binomial distribution to find the probability of getting the following result. More than 11 tails. Use the table of areas under the standard normal curve given below. Click here to view page 1. Click here to view page 2. Click here to view page 3. Click here to view page 4. Click here to view page 5. Click here to view page 6. Binomial probability = (Round to...
 A fnance executve would ike to determine if a relationship exists between the current earnings per share (EPS) of a bank and the total assets S billions), previous period's EPS, previous period's retun on average assets (ROAA), and the previous period's retun on average equity (ROAE) ROAA measures how effectively assets are utilized, and ROAE measures a firm's profitability. Complete parts a through d below EClick the icon to view the table of data. a. Construct a regression model using...
Most questions answered within 3 hours.
-
Sulfuric acid (250.0mL) is titrated with 176.5 mL 2.4 M NaOH to
an equivalence point (the...
asked 3 minutes ago -
The quality control manager of a cookie company is inspecting a
batch of chocolate-chip cookies that...
asked 5 minutes ago -
How can we identify what the horizontal force is when looking at
a merry go round?...
asked 37 minutes ago -
While Dime Community Bank is based in Brooklyn; management has
decided to focus its lending activity...
asked 1 hour ago -
1) Earnings functions, whereby the log of earnings is regressed
on years of education, years of...
asked 36 minutes ago -
Bruno Corporation is involved in the business of injection
molding of plastics. It is considering the...
asked 41 minutes ago -
What would be the vapor pressure of water at 96°C above a
solution made by dissolving...
asked 56 minutes ago -
Hydration of norbornene
Write the reaction. Discuss the intermediate. Explain how the
equilibrium in the reaction...
asked 1 hour ago -
Suppose that a party wanted to enter an FRA that expires in 42
days and is...
asked 1 hour ago -
ABC Ltd. estimated that a new store requires an initial
investment of $800,000. This new store...
asked 1 hour ago -
1. Review the Nike’s marketing strategy. You must include the
company’s target market, possible market segmentation,...
asked 1 hour ago -
One of the major advantages of ______________ is to enhance
security for private networks by keeping...
asked 1 hour ago