Computer upgrades have a nominal time of 80 minutes. Samples of five observations each have been ...
Computer upgrades have a nominal time of 80 minutes. Samples of
five observations each have been taken, and the results are as
listed.
| SAMPLE | |||||
| 1 | 2 | 3 | 4 | 5 | 6 |
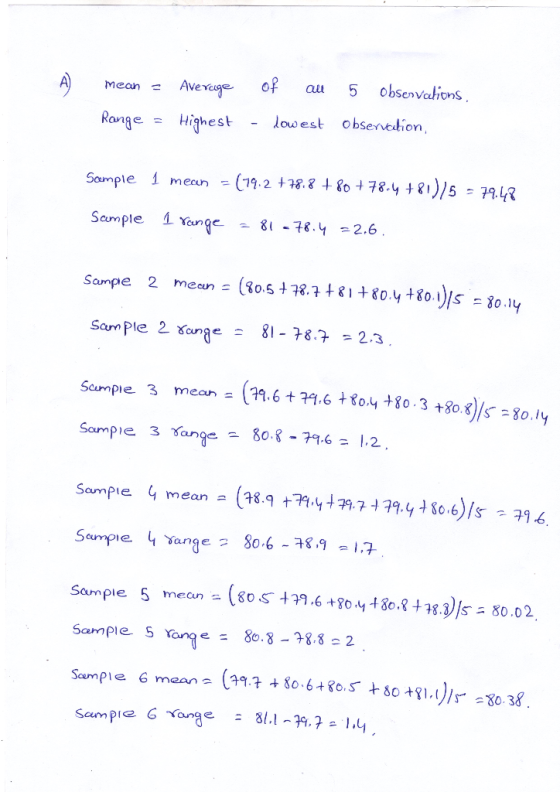
| 79.2 | 80.5 | 79.6 | 78.9 | 80.5 | 79.7 |
| 78.8 | 78.7 | 79.6 | 79.4 | 79.6 | 80.6 |
| 80.0 | 81.0 | 80.4 | 79.7 | 80.4 | 80.5 |
| 78.4 | 80.4 | 80.3 | 79.4 | 80.8 | 80.0 |
| 81.0 | 80.1 | 80.8 | 80.6 | 78.8 | 81.1 |
Factors for three-sigma control limits for x¯
and R charts
|
FACTORS FOR R CHARTS |
||||
| Number of Observations
in Subgroup, n |
Factor
for x¯ |
|||
| Chart, A2 |
Lower Control Limit, D3 |
Upper Control Limit, D4 |
||
| 2 | 1.88 | 0 | 3.27 | |
| 3 | 1.02 | 0 | 2.57 | |
| 4 | 0.73 | 0 | 2.28 | |
| 5 | 0.58 | 0 | 2.11 | |
| 6 | 0.48 | 0 | 2.00 | |
| 7 | 0.42 | 0.08 | 1.92 | |
| 8 | 0.37 | 0.14 | 1.86 | |
| 9 | 0.34 | 0.18 | 1.82 | |
| 10 | 0.31 | 0.22 | 1.78 | |
| 11 | 0.29 | 0.26 | 1.74 | |
| 12 | 0.27 | 0.28 | 1.72 | |
| 13 | 0.25 | 0.31 | 1.69 | |
| 14 | 0.24 | 0.33 | 1.67 | |
| 15 | 0.22 | 0.35 | 1.65 | |
| 16 | 0.21 | 0.36 | 1.64 | |
| 17 | 0.20 | 0.38 | 1.62 | |
| 18 | 0.19 | 0.39 | 1.61 | |
| 19 | 0.19 | 0.40 | 1.60 | |
| 20 | 0.18 | 0.41 | 1.59 | |
a. Using factors from above table, determine upper and
lower control limits for mean and range charts. (Round your
intermediate calculations and final answers to 2 decimal places.
Leave no cells blank - be certain to enter "0" wherever
required.)
| Mean Chart | Range Chart | |
| UCL | ||
| LCL | ||
b. Decide if the process is in control.
-
Yes
-
No
Homework Answers

Add Answer to:
Computer upgrades have a nominal time of 80 minutes. Samples of five observations each have been ...
Samples of five observations have been taken and are shown below: Sample 79.2 78.8 80.0 78.4...
 Samples of five observations have been taken and are shown below: Sample 79.2 78.8 80.0 78.4 81.0 80.5 78.7 81.0 80.4 80.1 79.6 79.6 80.4 80.3 80.8 78.9 79.4 79.7 79.4 80.6 80.5 79.6 80.4 80.8 78.8 79.7 80.6 80.5 80.0 81.1 Determine upper and lower control limits. Round all intermediate values to a maximum of three decimals. Round Mean and Range chart control limits to three decimals.
Specifications for the computer upgrades are 76 minutes and 81 minutes. Estimate the percentage of process...
Specifications for the computer upgrades are 76 minutes and 81 minutes. Estimate the percentage of process output that can be expected to fall within the specifications. (Round your answer to 1 decimal place. Omit the "%" sign in your response.) SAMPLE 1 2 3 4 5 6 79.2 80.1 79.6 78.9 80.4 79.7 79.7 78.7 79.6 78.7 79.6 80.6 80.0 81.0 80.2 79.7 80.4 80.5 78.4 80.4 80.3 79.4 78.8 80.0 81.0 80.1 80.8 80.6 78.8 81.1
Specifications for the computer upgrades are 76 minutes and 81 minutes. Estimate the percentage of process...
Specifications for the computer upgrades are 76 minutes and 81 minutes. Estimate the percentage of process output that can be expected to fall within the specifications. (Round your answer to 1 decimal place. Omit the "%" sign in your response.) SAMPLE 1 2 3 4 5 6 79.2 78.4 79.6 78.9 80.5 79.7 81.9 78.7 79.6 79.8 79.6 80.6 80.0 81.0 78.9 79.7 80.4 79.1 78.4 80.4 80.3 79.4 78.5 80.0 81.0 80.1 80.8 80.6 78.8 81.1 Expected process output ...
Specfications for the computer upgrades are 78 minutes and 81 minutes Estimate the percentage of process...
 Specfications for the computer upgrades are 78 minutes and 81 minutes Estimate the percentage of process output that can be expected to fall within the specifications. Hint. The normality assumption does not hold. (Round your answer to 1 decimal place. Omit the "%" sign in your response.) SAMPLE 4 6 79.2 80.5 79.6 78.9 80.5 79.7 78.8 78.7 79.6 79.4 79.6 8e.6 80.0 81.0 80.4 79.7 80.4 80.s 78.4 80.4 80.3 79.4 80.8 8e.e 81.0 80.1 80.8 8.6 78.8 81.1...
Specifications for the computer upgrades are 77 minutes and 81 minutes. Estimate the percentage of process...
 Specifications for the computer upgrades are 77 minutes and 81 minutes. Estimate the percentage of process output that can be expected to fall within the specifications. (Round your answer to 1 decimal place. Omit the "%" sign in your response.) SAMPLE $$ \begin{array}{cccccc} 1 & 2 & 3 & 4 & 5 & 6 \\ 79.2 & 83.2 & 79.6 & 78.9 & 80.8 & 79.7 \\ 80.3 & 78.7 & 79.6 & 79.2 & 79.6 & 80.6 \\ 80.0 & 81.0...
Specifications for the computer upgrades are 76 minutes and 81 minutes. Estimate the percentage of process...
 Specifications for the computer upgrades are 76 minutes and 81 minutes. Estimate the percentage of process output that can be expected to fall within the specifications. (Round your answer to 1 decimal place. Omit the "%" sign in your response.) SAMPLE 79.2 79.6 79.6 78.9 80.2 79.7 80.0 78.7 79.6 80.3 79-6 80.6 80.0 81.0 79.0 79.7 80.4 80.8 78.4 80.4 80.3 79-4 80.9 80.0 81.0 80.1 80.8 80.6 78.8 81.1 -96 Expected process output
Q1[10 pts]. Computer upgrades have a targeted time of 80 minutes. Six samples of 5 observations each have been taken, and the results are listed below. Determine the appropriate 98% control chart(s)...
 Q1[10 pts]. Computer upgrades have a targeted time of 80 minutes. Six samples of 5 observations each have been taken, and the results are listed below. Determine the appropriate 98% control chart(s) for monitoring the process. Is the process stable (i.e., in-control)? 2 3 4 6 80 79.5 79.4 79.3 79 80.2 80.1 80 80.5 79.6 79 78.2 80 81.2 80.9 80.5 79.9 80.4 80.1 81 78.9 81 81.1 80.1 81 82 79.8 80.4 79.6
Q1[10 pts]. Computer upgrades have...
Q1[10 pts]. Computer upgrades have a targeted time of 80 minutes. Six samples of 5 observations each have been taken, and the results are listed below. Determine the appropriate 98% control chart(s) for monitoring the process. Is the process stable (i.e., in-control)? 2 3 4 6 80 79.5 79.4 79.3 79 80.2 80.1 80 80.5 79.6 79 78.2 80 81.2 80.9 80.5 79.9 80.4 80.1 81 78.9 81 81.1 80.1 81 82 79.8 80.4 79.6
Q1[10 pts]. Computer upgrades have...
Checkout time at a supermarket is monitored using a mean and a range chart. Six samples...
Checkout time at a supermarket is monitored using a mean and a range chart. Six samples of n = 20 observations have been obtained and the sample means and ranges computed: Sample Mean Range Sample Mean Range 1 3.06 .42 4 3.13 .46 2 3.15 .49 5 3.06 .46 3 3.11 .41 6 3.09 .45 Factors for three-sigma control limits for x¯x¯ and R charts FACTORS FOR R CHARTS Number of Observations in Subgroup, n Factor for x¯x¯ Chart, A2 Lower...
6.15. Parts manufactured by an injection molding process are subjected to a compressive strength test. Twenty...
 6.15. Parts manufactured by an injection molding process are subjected to a compressive strength test. Twenty samples of five parts each are collected, and the compressive strengths (in psi) are shown in Table 6E.11. (a) Establish 7 and R control charts for compressive strength using these data. Is the process in statis- tical control? (b) After establishing the control charts in part (a), 15 new subgroups were collected and the com- pressive strengths are shown in Table GE.12. Plot the...
The time to replace vehicle wiper blades at a service center was monitored using a mean...
The time to replace vehicle wiper blades at a service center was monitored using a mean and a range chart. Six samples of n = 20 observations have been obtained and the sample means and ranges computed: Sample Mean Range Sample Mean Range 1 3.06 .42 4 3.13 .46 2 3.15 .50 5 3.06 .46 3 3.11 .41 6 3.09 .45 Factors for three-sigma control limits for and R charts FACTORS FOR R CHARTS Number of Observations in Subgroup, n...
 Samples of five observations have been taken and are shown below: Sample 79.2 78.8 80.0 78.4 81.0 80.5 78.7 81.0 80.4 80.1 79.6 79.6 80.4 80.3 80.8 78.9 79.4 79.7 79.4 80.6 80.5 79.6 80.4 80.8 78.8 79.7 80.6 80.5 80.0 81.1 Determine upper and lower control limits. Round all intermediate values to a maximum of three decimals. Round Mean and Range chart control limits to three decimals.
 Specfications for the computer upgrades are 78 minutes and 81 minutes Estimate the percentage of process output that can be expected to fall within the specifications. Hint. The normality assumption does not hold. (Round your answer to 1 decimal place. Omit the "%" sign in your response.) SAMPLE 4 6 79.2 80.5 79.6 78.9 80.5 79.7 78.8 78.7 79.6 79.4 79.6 8e.6 80.0 81.0 80.4 79.7 80.4 80.s 78.4 80.4 80.3 79.4 80.8 8e.e 81.0 80.1 80.8 8.6 78.8 81.1...
 Specifications for the computer upgrades are 77 minutes and 81 minutes. Estimate the percentage of process output that can be expected to fall within the specifications. (Round your answer to 1 decimal place. Omit the "%" sign in your response.) SAMPLE $$ \begin{array}{cccccc} 1 & 2 & 3 & 4 & 5 & 6 \\ 79.2 & 83.2 & 79.6 & 78.9 & 80.8 & 79.7 \\ 80.3 & 78.7 & 79.6 & 79.2 & 79.6 & 80.6 \\ 80.0 & 81.0...
 Specifications for the computer upgrades are 76 minutes and 81 minutes. Estimate the percentage of process output that can be expected to fall within the specifications. (Round your answer to 1 decimal place. Omit the "%" sign in your response.) SAMPLE 79.2 79.6 79.6 78.9 80.2 79.7 80.0 78.7 79.6 80.3 79-6 80.6 80.0 81.0 79.0 79.7 80.4 80.8 78.4 80.4 80.3 79-4 80.9 80.0 81.0 80.1 80.8 80.6 78.8 81.1 -96 Expected process output
 Q1[10 pts]. Computer upgrades have a targeted time of 80 minutes. Six samples of 5 observations each have been taken, and the results are listed below. Determine the appropriate 98% control chart(s) for monitoring the process. Is the process stable (i.e., in-control)? 2 3 4 6 80 79.5 79.4 79.3 79 80.2 80.1 80 80.5 79.6 79 78.2 80 81.2 80.9 80.5 79.9 80.4 80.1 81 78.9 81 81.1 80.1 81 82 79.8 80.4 79.6
Q1[10 pts]. Computer upgrades have...
Q1[10 pts]. Computer upgrades have a targeted time of 80 minutes. Six samples of 5 observations each have been taken, and the results are listed below. Determine the appropriate 98% control chart(s) for monitoring the process. Is the process stable (i.e., in-control)? 2 3 4 6 80 79.5 79.4 79.3 79 80.2 80.1 80 80.5 79.6 79 78.2 80 81.2 80.9 80.5 79.9 80.4 80.1 81 78.9 81 81.1 80.1 81 82 79.8 80.4 79.6
Q1[10 pts]. Computer upgrades have...
 6.15. Parts manufactured by an injection molding process are subjected to a compressive strength test. Twenty samples of five parts each are collected, and the compressive strengths (in psi) are shown in Table 6E.11. (a) Establish 7 and R control charts for compressive strength using these data. Is the process in statis- tical control? (b) After establishing the control charts in part (a), 15 new subgroups were collected and the com- pressive strengths are shown in Table GE.12. Plot the...
Most questions answered within 3 hours.
-
Company Risk Premium A company has a beta of
4.57. If the market return is expected...
asked 18 seconds ago -
Arthur Meiners is the production manager of Wheel-Rite, a small
producer of metal parts. Wheel-Rite supplies...
asked 1 minute ago -
3. Which statement about nuclear fission is correct? (1
point)
A. Nuclear fission provides energy for...
asked 6 minutes ago -
If a $2,000 increase in income leads to a $1,5000 increase in
consumption expenditures, then the...
asked 5 minutes ago -
May you please put this in layman's terms?
ABSTRACT
Coagulase-negative staphylococci (CoNS) and Staphylococcus
aureus are...
asked 10 minutes ago -
If authentic leadership is really a lifelong process,
can teenagers be authentic leaders? Why or why...
asked 26 minutes ago -
Six years of quarterly data of a seasonally adjusted series are
used to estimate a linear...
asked 45 minutes ago -
Which of the following is not an ecological model used
to foster behavior change?
PRECEDE-PROCEED Model...
asked 48 minutes ago -
On the Apollo 14 mission to the moon, astronaut Alan Shepard hit
a golf ball with...
asked 44 minutes ago -
What are John’s potential claims if he is terminated
this week?
John is a 54-year-old man...
asked 57 minutes ago -
A (8.5) cm tall object is placed at a distance of (14.2) cm from
a convex...
asked 1 hour ago -
(2) For the following questions, consider a data set that
exhibits a normal distribution. Report the...
asked 1 hour ago