The time to replace vehicle wiper blades at a service center was monitored using a mean...
|
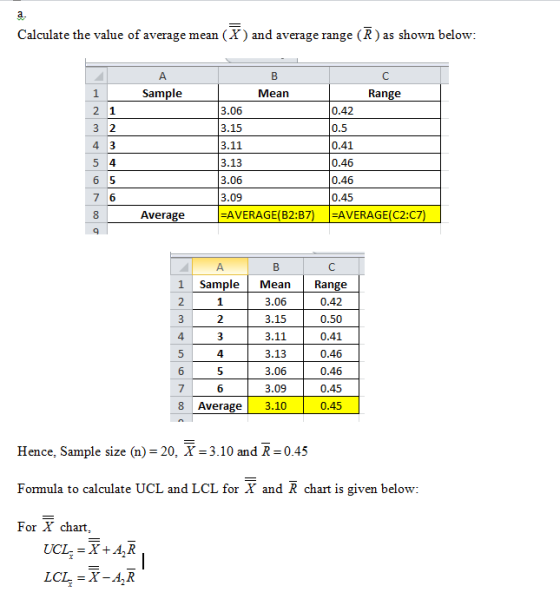
The time to replace vehicle wiper blades at a service center was monitored using a mean and a range chart. Six samples of n = 20 observations have been obtained and the sample means and ranges computed: |
| Sample | Mean | Range | Sample | Mean | Range |
| 1 | 3.06 | .42 | 4 | 3.13 | .46 |
| 2 | 3.15 | .50 | 5 | 3.06 | .46 |
| 3 | 3.11 | .41 | 6 | 3.09 | .45 |
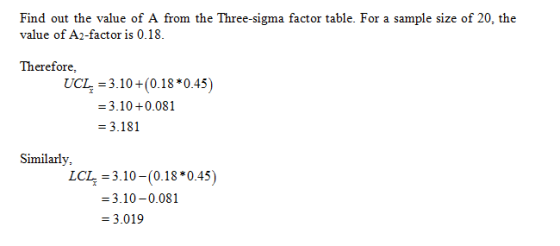
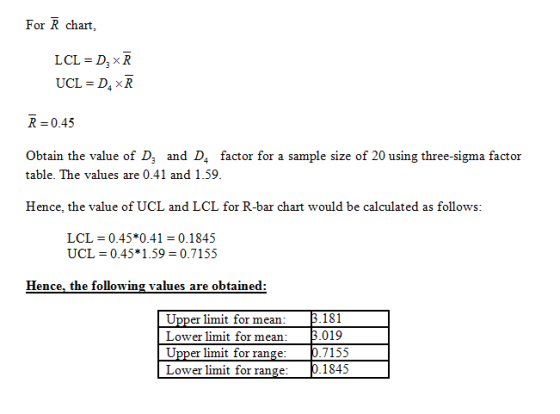
| Factors for
three-sigma control limits for |
|
FACTORS FOR R CHARTS |
|||
| Number of
Observations in Subgroup, n |
Factor
for A2 |
Lower Control Limit, D3 |
Upper Control Limit, D4 |
| 2 | 1.88 | 0 | 3.27 |
| 3 | 1.02 | 0 | 2.57 |
| 4 | 0.73 | 0 | 2.28 |
| 5 | 0.58 | 0 | 2.11 |
| 6 | 0.48 | 0 | 2.00 |
| 7 | 0.42 | 0.08 | 1.92 |
| 8 | 0.37 | 0.14 | 1.86 |
| 9 | 0.34 | 0.18 | 1.82 |
| 10 | 0.31 | 0.22 | 1.78 |
| 11 | 0.29 | 0.26 | 1.74 |
| 12 | 0.27 | 0.28 | 1.72 |
| 13 | 0.25 | 0.31 | 1.69 |
| 14 | 0.24 | 0.33 | 1.67 |
| 15 | 0.22 | 0.35 | 1.65 |
| 16 | 0.21 | 0.36 | 1.64 |
| 17 | 0.20 | 0.38 | 1.62 |
| 18 | 0.19 | 0.39 | 1.61 |
| 19 | 0.19 | 0.40 | 1.60 |
| 20 | 0.18 | 0.41 | 1.59 |
| a. |
Using the factors in the above table, determine upper and lower limits for mean and range charts. (Do not round intermediate calculations. Round your mean value to 3 decimal places and range value to 4 decimal places.) |
| Upper limit for mean: | |
| Lower limit for mean: | |
| Upper limit for range: | |
| Lower limit for range: | |
Homework Answers
Add Answer to:
The time to replace vehicle wiper blades at a service center was
monitored using a mean...
The time to replace vehicle wiper blades at a service center was monitored using a mean and a range chart.
 Question 3 The time to replace vehicle wiper blades at a service center was monitored using a mean and a range chart. Six samples of n = 20 observations were obtained, and the sample means and ranges computed: Sample Mean Range Sample Mean Range 3.06 .42 4 3.13 46 3.15 .50 3.06 46 3.11 41 3.09 45 Using the factors in the provided table, determine upper and lower limits for mean and range charts. Is the process in control?
Checkout time at a supermarket is monitored using a mean and a range chart. Six samples...
Checkout time at a supermarket is monitored using a mean and a range chart. Six samples of n = 20 observations have been obtained and the sample means and ranges computed: Sample Mean Range Sample Mean Range 1 3.06 .42 4 3.13 .46 2 3.15 .49 5 3.06 .46 3 3.11 .41 6 3.09 .45 Factors for three-sigma control limits for x¯x¯ and R charts FACTORS FOR R CHARTS Number of Observations in Subgroup, n Factor for x¯x¯ Chart, A2 Lower...
Computer upgrades have a nominal time of 80 minutes. Samples of five observations each have been ...
Computer upgrades have a nominal time of 80 minutes. Samples of five observations each have been taken, and the results are as listed. SAMPLE 1 2 3 4 5 6 79.2 80.5 79.6 78.9 80.5 79.7 78.8 78.7 79.6 79.4 79.6 80.6 80.0 81.0 80.4 79.7 80.4 80.5 78.4 80.4 80.3 79.4 80.8 80.0 81.0 80.1 80.8 80.6 78.8 81.1 Factors for three-sigma control limits for x¯ and R charts FACTORS FOR R CHARTS Number of Observations in Subgroup, n...
Question 4 [20 marks] By utilising Annexure A, answer the following questions: (a) 15 samples of...
 Question 4 [20 marks] By utilising Annexure A, answer the following questions: (a) 15 samples of n 8 have been taken from a cleaning operation. The average sample range for the 20 samples was 0.016 minute, and the average mean was 3 minutes. Determine the three-sigma control limits for this process. (4 marks) (b) 15 samples of n 10 observations have been taken from a milling process. The average sample range is 0.01 centimetres. Determine upper and lower control limits...
Problem 10-25 Resistors for electronic circuits are manufactured on a high-speed automated machin...
 Problem 10-25 Resistors for electronic circuits are manufactured on a high-speed automated machine. The machine is set up to produce a large run of resistors of 1,000 ohms each. Use Exhibit 10.13. To set up the machine and to create a control chart to be used throughout the run, 15 samples were taken with four resistors in each sample. The complete list of samples and their measured values are as follows: Use three-sigma control limits READINGS (IN OHMS) 1014 1019...
Checkout times at a drug store are being monitored and the following data has been collected. Each sample contained 20 items. Sample Mean Range 1 3.06 .42 2 3.15 .50 3 3.11 .41 4 3.13 .46...
Checkout times at a drug store are being monitored and the following data has been collected. Each sample contained 20 items. Sample Mean Range 1 3.06 .42 2 3.15 .50 3 3.11 .41 4 3.13 .46 5 3.06 .46 6 3.09 .45 Calculate the lower and upper control limits for the range. (Keep three decimal places) Question 43 options: Lower = 0.191 Upper = 0.664 Lower = 0.716 Upper = 0.175 Lower = 3.109 Upper = 3.211 Lower = 0.185...
An automatic lathe produces rollers for roller bearings, and the process is monitored by statistical process...
 An automatic lathe produces rollers for roller bearings, and the process is monitored by statistical process control charts. The central line of the chart for the sample means is set at 8.40 and for the mean range at 0.3 mm. The process is in control, as established by samples of size 5. The upper and lower specifications for the diameter of the rollers are (8.40 + 0.25) and (8.40 -0.25) mm, respectively. Click the icon to view the table of...
8 have been gathered with the following results A services process is monitored using x-bar and...
 8 have been gathered with the following results A services process is monitored using x-bar and R charts. Eight samples of n5 observations Sample 2 4 Mean 7.2 7.4 6.6 6.8 7.9 6.0 7.2 6.2 Range .43 .52 .53 20 .36 .42 .35 .42 7 8 Using this data, compute the centerline, the 3 sd upper control limit, and the lower control limits for the x-bar and R charts X-bar R-bar UCL r-bar LCL r-bar UCL x-bar LCL x-bar a....
QC.58 Dairy Man Industries produces a variety of dairy products such as cheese, sour cream and...
QC.58 Dairy Man Industries produces a variety of dairy products such as cheese, sour cream and yogurt. One of their more popular products is a 3-pound block of sliced American cheese. They have a high-speed manufacturing line that automatically slices, stacks, and packages this product. Each hour their automated equipment will sample 20 blocks of cheese to make sure they are close in weight to the target value of 48.1 ounces and within control limits. The table below contain the...
that was the complete data the second picture is the control limits Refer to Table S61...
 that was the complete data the second picture is the control
limits
Refer to Table S61 - Factors for Computing Control Chart Limits (3 sigma) for this problem. Ross Hopkins is attempting to monitor a filling process that has an overall average of 705 mL. The average range R is 8 ml. For a sample size of 10, the control limits for 3-sigma x chart are: Upper Control Limit (UCL.2)= ml (round your response to three decimal places). Lower Control...
that was the complete data the second picture is the control
limits
Refer to Table S61 - Factors for Computing Control Chart Limits (3 sigma) for this problem. Ross Hopkins is attempting to monitor a filling process that has an overall average of 705 mL. The average range R is 8 ml. For a sample size of 10, the control limits for 3-sigma x chart are: Upper Control Limit (UCL.2)= ml (round your response to three decimal places). Lower Control...
 Question 3 The time to replace vehicle wiper blades at a service center was monitored using a mean and a range chart. Six samples of n = 20 observations were obtained, and the sample means and ranges computed: Sample Mean Range Sample Mean Range 3.06 .42 4 3.13 46 3.15 .50 3.06 46 3.11 41 3.09 45 Using the factors in the provided table, determine upper and lower limits for mean and range charts. Is the process in control?
 Question 4 [20 marks] By utilising Annexure A, answer the following questions: (a) 15 samples of n 8 have been taken from a cleaning operation. The average sample range for the 20 samples was 0.016 minute, and the average mean was 3 minutes. Determine the three-sigma control limits for this process. (4 marks) (b) 15 samples of n 10 observations have been taken from a milling process. The average sample range is 0.01 centimetres. Determine upper and lower control limits...
 Problem 10-25 Resistors for electronic circuits are manufactured on a high-speed automated machine. The machine is set up to produce a large run of resistors of 1,000 ohms each. Use Exhibit 10.13. To set up the machine and to create a control chart to be used throughout the run, 15 samples were taken with four resistors in each sample. The complete list of samples and their measured values are as follows: Use three-sigma control limits READINGS (IN OHMS) 1014 1019...
 An automatic lathe produces rollers for roller bearings, and the process is monitored by statistical process control charts. The central line of the chart for the sample means is set at 8.40 and for the mean range at 0.3 mm. The process is in control, as established by samples of size 5. The upper and lower specifications for the diameter of the rollers are (8.40 + 0.25) and (8.40 -0.25) mm, respectively. Click the icon to view the table of...
 8 have been gathered with the following results A services process is monitored using x-bar and R charts. Eight samples of n5 observations Sample 2 4 Mean 7.2 7.4 6.6 6.8 7.9 6.0 7.2 6.2 Range .43 .52 .53 20 .36 .42 .35 .42 7 8 Using this data, compute the centerline, the 3 sd upper control limit, and the lower control limits for the x-bar and R charts X-bar R-bar UCL r-bar LCL r-bar UCL x-bar LCL x-bar a....
 that was the complete data the second picture is the control
limits
Refer to Table S61 - Factors for Computing Control Chart Limits (3 sigma) for this problem. Ross Hopkins is attempting to monitor a filling process that has an overall average of 705 mL. The average range R is 8 ml. For a sample size of 10, the control limits for 3-sigma x chart are: Upper Control Limit (UCL.2)= ml (round your response to three decimal places). Lower Control...
that was the complete data the second picture is the control
limits
Refer to Table S61 - Factors for Computing Control Chart Limits (3 sigma) for this problem. Ross Hopkins is attempting to monitor a filling process that has an overall average of 705 mL. The average range R is 8 ml. For a sample size of 10, the control limits for 3-sigma x chart are: Upper Control Limit (UCL.2)= ml (round your response to three decimal places). Lower Control...
Most questions answered within 3 hours.
-
Walgreen Company (NYSE: WAG) is currently trading at $48.50 on
the NYSE. Walgreen Company is also...
asked 10 minutes ago -
Based on historical data, your team knows what proportion of the
company's orders come from Males...
asked 28 minutes ago -
8. Which of the following atoms has the largest magnitude
electron affinity?
(a) Sodium (Na)
(b)...
asked 31 minutes ago -
Assess the two types of tests of cognitive abilities. (
regarding HR course)
asked 36 minutes ago -
1.Write an inspiring vision statement for an organization where
you work or have worked. If the...
asked 37 minutes ago -
2. Is fair trade coffee sustainable for the mass market,
or is it a niche product...
asked 38 minutes ago -
Please answer this asap in MATLAB.
In the following for loop, the the loop is executed...
asked 50 minutes ago -
A 50.0-g golf ball is driven from the tee with an initial speed
of 44.6 m/s...
asked 45 minutes ago -
Use the molar concentration of the 50 mL solution to calculate
the moles of Cr(III) in...
asked 47 minutes ago -
Calculate the molarity of Fe3+ in solution A.
Solution A: 10 mL of 0.0600 M Fe(No3)3 ...
asked 56 minutes ago -
two dogs pull 2 strings horizontally which are tied to a sleigh.
the angle between the...
asked 57 minutes ago -
please write a paper about any ethical violation based on the
case study Stanford's Prison Experiment....
asked 1 hour ago