
Homework Answers
Add Answer to:
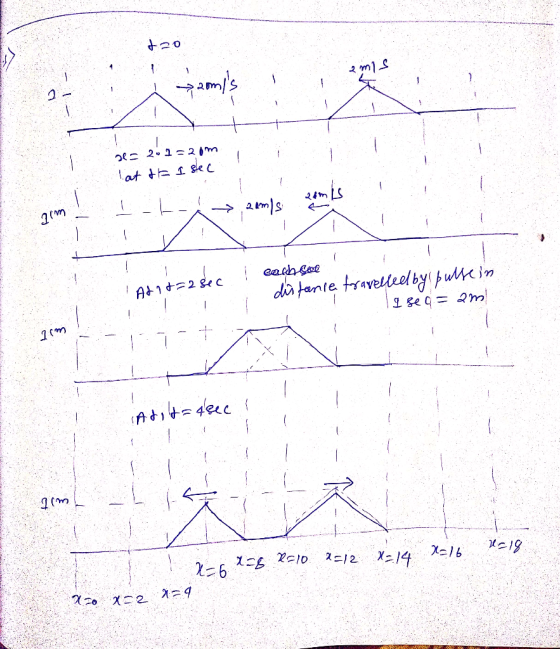
1. (15pts) The picture below shows two pulse waves approaching each other on a stretched string...
(Figure 1) is a snapshot graph at t=0s of two waves on a string approaching each other at 1 m/s .
 (Figure 1) is a snapshot graph at t=0s of two waves on a string approaching each other at 1 m/s .Part A List the values of the displacement of the string at x=50 m at 1s intervals from t=0s to t=6s.
The figure on the left is a snapshot graph at t=0s of two waves on a string approaching each other at 1 m/s
 The figure on the left is a snapshot graph at t=0s of two waves on a string approaching each other at 1 m/s Part AAt what time was the snapshot graph in the figure on the right taken?
(17) The pulses shown in the figure are traveling through a string. Draw a snapshot graph...
 (17) The pulses shown in the figure are traveling through a string. Draw a snapshot graph for the string at t = 2.0 s. y (cm) at t=0 1 1 m/s 0 10 x (m) 8 y (cm) at i=0 1 1 m/s 1 m/s -14 0 10, *(m) 6 N 8 1 m/s
Figure A below is a snapshot graph at t = 0 s of two waves on a string approaching each other at 1 m/s. At what time was the snapshot graph in figure B taken? (Please do this item on the paper graph)
Figure A below is a snapshot graph at t = 0 s of two waves on a string approaching each other at 1 m/s. At what time was the snapshot graph in figure B taken? (Please do this item on the paper graph)
I need help understanding these problems, they’re a bit difficult Two pulses on a string, both...
 I need help understanding these problems, they’re a bit
difficult
Two pulses on a string, both traveling at 10m/s, are approaching each other. A snapshot at t-0s is shown below a) Draw d snapshot graph D (in mm) of the string at t-ls. b) Draw da snapshot graph of the string at t-1.2s. c) Which time (a or b) had a point 2 on the string with the greatest displacement? Att - 0s 10 m/s 10 m/s x (in m)...
I need help understanding these problems, they’re a bit
difficult
Two pulses on a string, both traveling at 10m/s, are approaching each other. A snapshot at t-0s is shown below a) Draw d snapshot graph D (in mm) of the string at t-ls. b) Draw da snapshot graph of the string at t-1.2s. c) Which time (a or b) had a point 2 on the string with the greatest displacement? Att - 0s 10 m/s 10 m/s x (in m)...
(17) The pulses shown in the figure are traveling through a string. Draw a snapshot graph...
 (17) The pulses shown in the figure are traveling through a string. Draw a snapshot graph for the string at t = 2.0 s. y (cm) at i=0 s 1 1 m/s 0 2 4 6 8 x (m) 10 -1 1 m/s
(Figure 1) (a) is a snapshot graph at t 0 s of two waves approaching each other at 1.0 m/s
 (Figure 1) (a) is a snapshot graph at t 0 s of two waves approaching each other at 1.0 m/s Part A At what time was the snapshot graph (b) taken?
12. Below are two history graphs for wave pulses on a string. The speed and direction...
 12. Below are two history graphs for wave pulses on a string. The speed and direction of each pulse are índicated. For each, draw the snapshot graph at the specified instant of time. No distance scale is provided, so you must determine an appropriate scale and label the x-axis appropriately a. b. History atx=2cm Atx=-1 cm t (s) t (s) 0,02 0.04 0.06 -006 -002 006, 00 cm's to the left 50 cm/s to the left Snapshot at t= 0.02...
3. [lpt] Consider the wave pulses shown in snapshot graphs i-iv below. Each pulse has a...
 3. [lpt] Consider the wave pulses shown in snapshot graphs i-iv below. Each pulse has a time, absolute phase speed, and travel direction given below it. R) -3 -2 -1 1 23 45 6 7 X (n) 2 s, 1 m/s -3-2 -1 1 23 45 6 7 x (m) t1.5 , 2 m/s- iv) -1 -32 -1 1 23 45 6 7 x Cn) 1-4s, 1 m/s → -3 -2 -1 0 12 3 4 5 6 7 x...
Consider the wave pulses shown in snapshot graphs i-iv below. Each pulse has a time, absolute...
Consider the wave pulses shown in snapshot graphs i-iv below. Each pulse has a time, absolute phase speed, and travel direction given below it. i) t = 1 s, 1 m/s ← ii) t = 0 s, 2 m/s → iii) t = 2 s, 1 m/s → iv) t = 3 s, 1 m/s → Select the corresponding history graph A-D given below (or `none') for each snapshot graph. E.g., if the first snapshot has B as a corresponding...
 (17) The pulses shown in the figure are traveling through a string. Draw a snapshot graph for the string at t = 2.0 s. y (cm) at t=0 1 1 m/s 0 10 x (m) 8 y (cm) at i=0 1 1 m/s 1 m/s -14 0 10, *(m) 6 N 8 1 m/s
 I need help understanding these problems, they’re a bit
difficult
Two pulses on a string, both traveling at 10m/s, are approaching each other. A snapshot at t-0s is shown below a) Draw d snapshot graph D (in mm) of the string at t-ls. b) Draw da snapshot graph of the string at t-1.2s. c) Which time (a or b) had a point 2 on the string with the greatest displacement? Att - 0s 10 m/s 10 m/s x (in m)...
I need help understanding these problems, they’re a bit
difficult
Two pulses on a string, both traveling at 10m/s, are approaching each other. A snapshot at t-0s is shown below a) Draw d snapshot graph D (in mm) of the string at t-ls. b) Draw da snapshot graph of the string at t-1.2s. c) Which time (a or b) had a point 2 on the string with the greatest displacement? Att - 0s 10 m/s 10 m/s x (in m)...
 (17) The pulses shown in the figure are traveling through a string. Draw a snapshot graph for the string at t = 2.0 s. y (cm) at i=0 s 1 1 m/s 0 2 4 6 8 x (m) 10 -1 1 m/s
 12. Below are two history graphs for wave pulses on a string. The speed and direction of each pulse are índicated. For each, draw the snapshot graph at the specified instant of time. No distance scale is provided, so you must determine an appropriate scale and label the x-axis appropriately a. b. History atx=2cm Atx=-1 cm t (s) t (s) 0,02 0.04 0.06 -006 -002 006, 00 cm's to the left 50 cm/s to the left Snapshot at t= 0.02...
 3. [lpt] Consider the wave pulses shown in snapshot graphs i-iv below. Each pulse has a time, absolute phase speed, and travel direction given below it. R) -3 -2 -1 1 23 45 6 7 X (n) 2 s, 1 m/s -3-2 -1 1 23 45 6 7 x (m) t1.5 , 2 m/s- iv) -1 -32 -1 1 23 45 6 7 x Cn) 1-4s, 1 m/s → -3 -2 -1 0 12 3 4 5 6 7 x...
Most questions answered within 3 hours.
-
D. A student completed 20 courses in the School of Arts and
Sciences. Her grades in...
asked 45 minutes ago -
teo
pucks moving on a frictionless air table are about to collide. the
1.5 kg puck...
asked 50 minutes ago -
Problem #1
The area between Z = 0 and Z = 2.50
The area between Z...
asked 2 hours ago -
1. What is the meaning of the term communication style?
2. What are the benefits to...
asked 1 hour ago -
9.) You are buying a car that cost $26,500. You make payments of
$412 each month...
asked 2 hours ago -
. Suppose a discrete random variable has probability
distribution
P(x) = .2 if x = 0...
asked 3 hours ago -
Under the influence of its drive force, a snowmobile is moving
at a constant velocity along...
asked 3 hours ago -
Why do organizations decline? What steps can top
management take to halt, decline, and restore organizational...
asked 3 hours ago -
What mechanisms Drive speciation??
(I.e. what was Dawins theory on the orgin of species, and how...
asked 5 hours ago -
The manager at a car assembly plant believes that the mean
assembly time for a car...
asked 6 hours ago -
Which of the following is true of electron capture?
A) It decreases the nuclide's mass number...
asked 7 hours ago -
Assuming an efficiency of 43.10%, calculate the actual yield of
magnesium nitrate formed from 114.9 g...
asked 8 hours ago