IS THE T-TEST CORRECT FOR THIS DATA? IS THERE A SIGNIFICANT DIFFERENCE?

Homework Answers
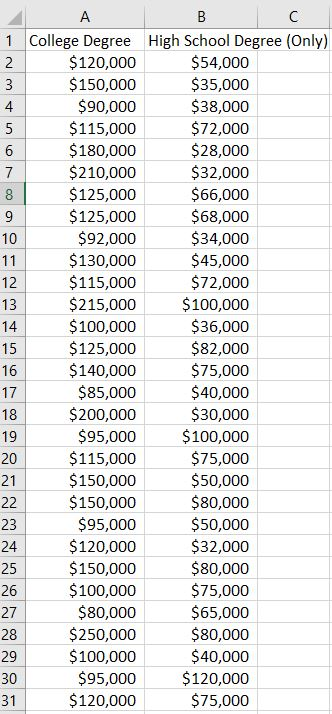
YES THE TEST IS CORRECT . TWO SAMPLE T TEST UNEQUAL VARIANCE .
HERE , PVALUE IS VERY LOW . IT IS LESS THAN LEVEL OF SIGNIFICANCE. HENCE WE REJECT THE NULL HYPOTHESIS.
HENCE, THERE IS STATISTICALLY SIGNIFICANT DIFFERENCE .
Add Answer to:
IS THE T-TEST CORRECT FOR THIS DATA? IS THERE A SIGNIFICANT
DIFFERENCE?
C А в 1...
How do I write the results of this t-test out in a statsically way ? $120,000...
 How do I write the results of this t-test out in a statsically
way ?
$120,000 $75,000 t-Test: Two-Sample Assuming Unequal Variances Mean College Degree 131233.3333 1795633333 30 High School Degree (Only) 60966.66667 582171264.4 Variance Observations Hypothesized Mean Difference df 46 t Stat P(T<=t) one-tail t Critical one-tail PIT<=t) two-tail t Critical two-tail 7.892632799 2.1299E-10 1.678660414 4.2598E-10 2.012895599
How do I write the results of this t-test out in a statsically
way ?
$120,000 $75,000 t-Test: Two-Sample Assuming Unequal Variances Mean College Degree 131233.3333 1795633333 30 High School Degree (Only) 60966.66667 582171264.4 Variance Observations Hypothesized Mean Difference df 46 t Stat P(T<=t) one-tail t Critical one-tail PIT<=t) two-tail t Critical two-tail 7.892632799 2.1299E-10 1.678660414 4.2598E-10 2.012895599
Suppose you want to determine whether there is a significant difference in mean test scores for...
Suppose you want to determine whether there is a significant difference in mean test scores for females and males. The test is out of 600 points. Using the following hypotheses: Ho: U1 - U2 = 0 HA: U1 - U2 (not equal) 0 And alpha of 0.05 you obtain the following results t-test Two-sample assuming unequal variances Females Males Mean 525 487 Variance 3530.8 2677.818182 Observations 16 12 Hypothesized Mean Difference 0 df 25 t stat 1.803753 P (T<=t) one...
Stress between males and females *Note: alpha = .001 1 t-Test: Two-Sample Assuming Unequal Variances Female...
 Stress between males and females
*Note: alpha = .001
1 t-Test: Two-Sample Assuming Unequal Variances Female Male 4 Mean 5 Variance 6 Observations 7 Hypothesized Mean Difference 3.655737705 3.52857143 1.296174863 1.12236025 70 61 8 df 9 t Stat 10 P(T-t) one-tail 11 t Critical one-tail 12 P(T<-t) two-tail 13 t Critical two-tail 124 0.658596658 0.255687918 3.157259054 0.511375836 3.370720124 Student Survey Data (2 Sample t-test) 1. Test Decision & Basis 2. Interpretation of Test Decision:
Stress between males and females
*Note: alpha = .001
1 t-Test: Two-Sample Assuming Unequal Variances Female Male 4 Mean 5 Variance 6 Observations 7 Hypothesized Mean Difference 3.655737705 3.52857143 1.296174863 1.12236025 70 61 8 df 9 t Stat 10 P(T-t) one-tail 11 t Critical one-tail 12 P(T<-t) two-tail 13 t Critical two-tail 124 0.658596658 0.255687918 3.157259054 0.511375836 3.370720124 Student Survey Data (2 Sample t-test) 1. Test Decision & Basis 2. Interpretation of Test Decision:
A professor in the Business department wants to know if there is a significant difference in...
A professor in the Business department wants to know if there is a significant difference in the performance on the first exam between two different classes. One class meets in the morning while the other meets at night. The results of this test are listed below along with an excel analysis conducted at the 5% significance level (α=0.05). t-Test: Two-Sample Assuming Equal Variances 8 am Class 7 pm Class Sample Mean 80.471 76.846 Sample Variance 97.51 162.14 Sample Observations 17...
A movie theater company wants to see if there is a difference in the average price...
 A movie theater company wants to see if there is a difference in the average price of movie tickets in Memphis and Minneapolis. They sample 25 ticket stubs from Memphis and 20 from Minneapolis. Test the claim using a 10% level of significance. Assume the population variances are unequal and that movie ticket prices are normally distributed. Give answer to at least 4 decimal places. Minneapolis Memphis 8 9 10 12 9 13 10 11 10 10 10 11 9...
5. L. Wallace, the president of a major public university, believes students’ grade-point-averages [GPAs] decline when...
5. L. Wallace, the president of a major public university, believes students’ grade-point-averages [GPAs] decline when students transition from high school to college, on average. To test President Wallace’s belief, you selected a random sample of 41 students enrolled in BMGT 230 this semester and conducted a test to compare each student’s high school GPA [HS_GPA] to their current college GPA [COLL_GPA]. Use the MS Excel output below to answer/complete Parts a through d: t-Test: Paired Two Sample for Means...
A professor in the Business department wants to know if there is a significant difference in...
A professor in the Business department wants to know if there is a significant difference in the performance on the first exam between two different classes. One class meets in the morning while the other meets at night. The results of this test are listed below along with an excel analysis conducted at the 5% significance level (α=0.05). t-Test: Two-Sample Assuming Equal Variances 8 am Class 7 pm Class Sample Mean 80.471 76.846 Sample Variance 97.51 162.14 Sample Observations 17...
t-Test: Two-Sample Assuming Equal Variances Variable 1 Variable 2 Mean 12.89795918 17.66666667 Variance 161.2185374 567.8266667 Observations...
t-Test: Two-Sample Assuming Equal Variances Variable 1 Variable 2 Mean 12.89795918 17.66666667 Variance 161.2185374 567.8266667 Observations 49 51 Pooled Variance 368.6716646 Hypothesized Mean Difference 0 Df 98 t Stat -1.241549191 P(T<=t) one-tail 0.108683158 t Critical one-tail 1.660551217 P(T<=t) two-tail 0.217366316 t Critical two-tail 1.984467455 Is there a significant difference between the two sample means? If you answer, “yes,” what is your reasoning? If you answer, “no,” what is your reasoning? Please state the conclusion, or your interpretation of the results in terms...
ACC 160 ASA COLLEGE PROF. K. JEFFERS FALL 2019 FINAL "A" NAME: SHOW ALL CALCULATIONS WHERE...
 ACC 160 ASA COLLEGE PROF. K. JEFFERS FALL 2019 FINAL "A" NAME: SHOW ALL CALCULATIONS WHERE REQUIRED Section 1-INTRODUCTION TO ACCOUNTING FOR INVENTORY All companies are on a calendar year unless otherwise stated. 1. During ZipCo's first year of operation, it purchases $125,000 of inventory on account. If ending inventory is $25,000, and sales are $150,000, what is ZipCo's first-year gross profit? $25,000 b. a. $50,000 $75,000 d. c. $100,000 For the year, FlabCo has beginning inventory of $120,000 and...
13. To see if studying with Mozart music changes (or makes a difference for) math scores,...
 13. To see if studying with Mozart music changes (or makes a difference for) math scores, a psychologist recruited 16 individuals of equal math ability. Eight were randomly selected for the "study with Mozart" group and the other eight were assigned to the "study without Mozart" group. The data are test scores. An Excel analysis of the data is shown below. t-Test: Two-Sample Assuming Unequal Variances a. 4 pts. Which type of alternative hypothesis is more appropriate for the research...
 How do I write the results of this t-test out in a statsically
way ?
$120,000 $75,000 t-Test: Two-Sample Assuming Unequal Variances Mean College Degree 131233.3333 1795633333 30 High School Degree (Only) 60966.66667 582171264.4 Variance Observations Hypothesized Mean Difference df 46 t Stat P(T<=t) one-tail t Critical one-tail PIT<=t) two-tail t Critical two-tail 7.892632799 2.1299E-10 1.678660414 4.2598E-10 2.012895599
How do I write the results of this t-test out in a statsically
way ?
$120,000 $75,000 t-Test: Two-Sample Assuming Unequal Variances Mean College Degree 131233.3333 1795633333 30 High School Degree (Only) 60966.66667 582171264.4 Variance Observations Hypothesized Mean Difference df 46 t Stat P(T<=t) one-tail t Critical one-tail PIT<=t) two-tail t Critical two-tail 7.892632799 2.1299E-10 1.678660414 4.2598E-10 2.012895599
 Stress between males and females
*Note: alpha = .001
1 t-Test: Two-Sample Assuming Unequal Variances Female Male 4 Mean 5 Variance 6 Observations 7 Hypothesized Mean Difference 3.655737705 3.52857143 1.296174863 1.12236025 70 61 8 df 9 t Stat 10 P(T-t) one-tail 11 t Critical one-tail 12 P(T<-t) two-tail 13 t Critical two-tail 124 0.658596658 0.255687918 3.157259054 0.511375836 3.370720124 Student Survey Data (2 Sample t-test) 1. Test Decision & Basis 2. Interpretation of Test Decision:
Stress between males and females
*Note: alpha = .001
1 t-Test: Two-Sample Assuming Unequal Variances Female Male 4 Mean 5 Variance 6 Observations 7 Hypothesized Mean Difference 3.655737705 3.52857143 1.296174863 1.12236025 70 61 8 df 9 t Stat 10 P(T-t) one-tail 11 t Critical one-tail 12 P(T<-t) two-tail 13 t Critical two-tail 124 0.658596658 0.255687918 3.157259054 0.511375836 3.370720124 Student Survey Data (2 Sample t-test) 1. Test Decision & Basis 2. Interpretation of Test Decision:
 A movie theater company wants to see if there is a difference in the average price of movie tickets in Memphis and Minneapolis. They sample 25 ticket stubs from Memphis and 20 from Minneapolis. Test the claim using a 10% level of significance. Assume the population variances are unequal and that movie ticket prices are normally distributed. Give answer to at least 4 decimal places. Minneapolis Memphis 8 9 10 12 9 13 10 11 10 10 10 11 9...
 ACC 160 ASA COLLEGE PROF. K. JEFFERS FALL 2019 FINAL "A" NAME: SHOW ALL CALCULATIONS WHERE REQUIRED Section 1-INTRODUCTION TO ACCOUNTING FOR INVENTORY All companies are on a calendar year unless otherwise stated. 1. During ZipCo's first year of operation, it purchases $125,000 of inventory on account. If ending inventory is $25,000, and sales are $150,000, what is ZipCo's first-year gross profit? $25,000 b. a. $50,000 $75,000 d. c. $100,000 For the year, FlabCo has beginning inventory of $120,000 and...
 13. To see if studying with Mozart music changes (or makes a difference for) math scores, a psychologist recruited 16 individuals of equal math ability. Eight were randomly selected for the "study with Mozart" group and the other eight were assigned to the "study without Mozart" group. The data are test scores. An Excel analysis of the data is shown below. t-Test: Two-Sample Assuming Unequal Variances a. 4 pts. Which type of alternative hypothesis is more appropriate for the research...
Most questions answered within 3 hours.
-
Temperament can play a role in parenting style and, sometimes, it
can be challenging for a...
asked 2 minutes ago -
Company XYZ uses a standard costing to evaluate operational
performance against budget.
The following budget and...
asked 3 minutes ago -
How does procurement play a role in the value chain process?
Give an example.
asked 14 minutes ago -
6.) A clay vase on a potter's wheel experiences an angular
acceleration of 7.90 rad/s2 due...
asked 14 minutes ago -
Question about JS form validation:
I want to check these two input (name, question) with
one...
asked 16 minutes ago -
Acetic acid, CH3COOH, Ka = 1.8 x 10⁻⁵ can be converted
into the acetate ion, CH3COO-2,...
asked 17 minutes ago -
An optical fiber consisting of a core made of glass (n = 1.667)
surrounded by a...
asked 19 minutes ago -
Bright and dark fringes are seen on a screen when light from a
single source reaches...
asked 28 minutes ago -
C9H12
13C NMR
7 peaks
1H NMR
δ 1.13 (triplet, 3H); δ 1.71 (multiplet, 2H); δ...
asked 39 minutes ago -
Consider a monoatomic ideal gas undergoing the following cycle:
starting point (a), pressure increases at a...
asked 39 minutes ago -
10) (a) In a hypothesis testing procedure explain the difference
between a type 1 and type...
asked 41 minutes ago -
Given the line notation, identify the anodic and
cathodic reactions and overall reaction:
Ag(s)| AgCl(s) |...
asked 1 hour ago