Calculate the missing values in the following table. Missing values are denoted by a number inside...
Calculate the missing values in the following table. Missing values are denoted by a number inside a bracket [X]. Place your answers in the corresponding numbered fields below the table.
| quantity | FC | VC | TC | AFC | AVC | ATC | MC |
| 0 | 150 | 0 | (1) | ---- | --- | --- | --- |
| 1 | (2) | (3) | 200 | (4) | (5) | (6) | (7) |
| 2 | (8) | (9) | (10) | (11) | 30 | (12) | (13) |
| 3 | (14) | (15) | (16) | (17) | (18) | (19) | 30 |
Homework Answers
Add Answer to:
Calculate the missing values in the following table. Missing
values are denoted by a number inside...
Given the below table: Q FC VC TC AFC AVC ATC MC 0 120 1 180...
Given the below table: Q FC VC TC AFC AVC ATC MC 0 120 1 180 2 220 3 270 4 360 5 470 6 600 Complete the table. Draw the diagram with the curves of TC, VC and FC. Draw the diagram of the curves of ATC, AVC and AFC.
Calculate the missing values on the chart: Replace all the “?” marks. F A B C...
 Calculate the missing values on the chart: Replace all the “?”
marks.
F A B C D E Calculate the missing values: replace all the ? Production and Cost Functions B C D Wage = 6 E AFC MC MPTPLAPVCI 0 0 - 16 ? 2.0 4 2.0 5 2. 3 .0 5.5 23 28 1.1 2.0 3.1 GWN- 16 7 0.6 LE22.1 - 20 4.0 40 2.0 2 6 3.8 36 0.4 1.6 Immo-ID888888 25 7 3 .6 ?...
Calculate the missing values on the chart: Replace all the “?”
marks.
F A B C D E Calculate the missing values: replace all the ? Production and Cost Functions B C D Wage = 6 E AFC MC MPTPLAPVCI 0 0 - 16 ? 2.0 4 2.0 5 2. 3 .0 5.5 23 28 1.1 2.0 3.1 GWN- 16 7 0.6 LE22.1 - 20 4.0 40 2.0 2 6 3.8 36 0.4 1.6 Immo-ID888888 25 7 3 .6 ?...
L K Q VC FC TC AVC AFC ATC MC 0 5 0 0 5 5...
L K Q VC FC TC AVC AFC ATC MC 0 5 0 0 5 5 1 5 2 2 5 7 1.00 2.50 3.50 1.00 2 5 6 4 5 9 0.67 0.83 1.50 0.50 3 5 12 6 5 11 0.50 0.42 0.92 0.33 4 5 19 8 5 13 0.42 0.26 0.68 0.29 5 5 25 10 5 15 0.40 0.20 0.60 0.33 6 5 28 12 5 17 0.43 0.18 0.61 0.67 7 5 29 14...
for question 2 use the information in picture 2 and use as much deatil as possible....
 for question 2 use the information in picture 2 and use as
much deatil as possible.
2) With "generic" graphs, illustrate the profit maximizing quantity, price, and ATC from the solution in #1. Make sure to draw an ATC, AVC, MC, and MR curve. ATC MC MR. The table below provides the values for different types of costs. Note that FC is fixed at 3 for all . This gives VC-TC - FC Next we find AVC - VC/O and...
for question 2 use the information in picture 2 and use as
much deatil as possible.
2) With "generic" graphs, illustrate the profit maximizing quantity, price, and ATC from the solution in #1. Make sure to draw an ATC, AVC, MC, and MR curve. ATC MC MR. The table below provides the values for different types of costs. Note that FC is fixed at 3 for all . This gives VC-TC - FC Next we find AVC - VC/O and...
Find FC, VC, TC, AFC, AVC, ATC, and MC from the following table. Capital costs $50 per unit, and two units of capital a...
 Find FC, VC, TC, AFC, AVC, ATC, and MC from the following table. Capital costs $50 per unit, and two units of capital are used in the short run. Labor costs $20 per unit. 7. Total Cost Average Average Marginal Variable Cost |(MC) Fixed Units of Units of Variable Average Fixed Labor (L) Cost (FC) Cost (VC) (TC) Total Cost Output (ATC) (Q) Cost Cost (AFC) (AVC) 0 0 1 2 2 4 3 6 4 8 10
8 9 10 11 The table below provides some information on various cost measures of a...
 8 9 10 11 The table below provides some information on various cost measures of a business. Use the available information to calculate the missing numbers: Q FC VC TC МC AFC AVC АТC 0 30 10 20 100 30 210 40 50 8.4 Check Next page ge 9,284. NON os The table below provides some information on various cost measures of a business. Use th missing numbers: Q FC VC TC мс AFC AVC ATC 0 30 10 20...
The total costs for Morris Industries are summarized in the following table. Based on this information,...
The total costs for Morris Industries are summarized in the following table. Based on this information, fill in the missing entries in the table for fixed cost, variable cost, average fixed cost, average variable cost, average total cost, and marginal cost. (1) (2) (3) (4) (5) (6) (7) (8) Q FC VC TC AFC AVC ATC MC 0 1,000 10 2,000 20 2,500 30 4,000 40 6,000 50 10,000 60 15,000
Find TC, MC, AFC, AVC, and ATC from the following table. Instructions: Enter your responses rounded...
 Find TC, MC, AFC, AVC, and ATC from the following table. Instructions: Enter your responses rounded to two decimal places. Units (Q) VC($) TC($) MC($) | AFC($) AVC($) ATC($) FC($) 100 100 100 100 100 100 40 60 TDTT 70 85 130 (Note: Marginal costs should be interpreted as between levels of output.)
The cost table below has enough information for you to completely fill out the blanks in...
 The cost table below has enough information for you to completely fill out the blanks in the five rows (output 0, 1, 2, 3, 4). Here is a hint: at Q=4 you are told that AFC is 30. Since AFC=FC/Q, you know that FC must be 120. And, of course FC is the same for all output levels, including zero. Now you have the first column completed! FC VC TC MC AFC AVC ATC 10 168
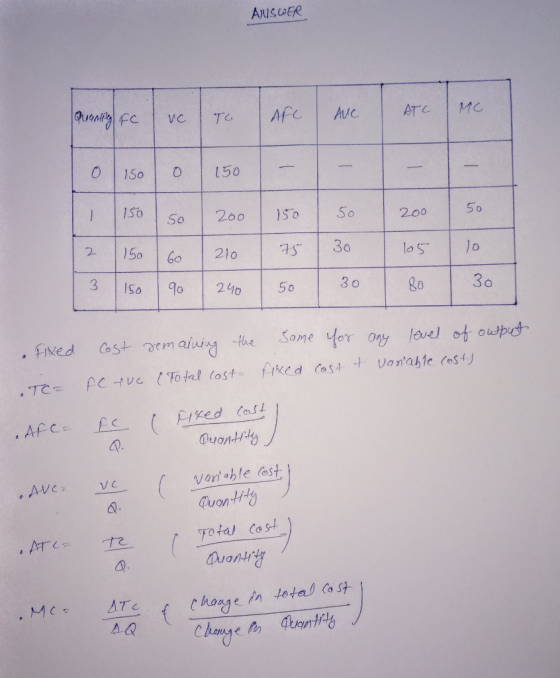
Quantity FC VC AFC AVC ATC MC [1] [2] [3] [4] [5] [6] [7] [8] [9]...
 Quantity FC VC AFC AVC ATC MC [1] [2] [3] [4] [5] [6] [7] [8] [9] [10] [11] [12] [13] [14] [15] [16] [17] [18] [19] 30
 Calculate the missing values on the chart: Replace all the “?”
marks.
F A B C D E Calculate the missing values: replace all the ? Production and Cost Functions B C D Wage = 6 E AFC MC MPTPLAPVCI 0 0 - 16 ? 2.0 4 2.0 5 2. 3 .0 5.5 23 28 1.1 2.0 3.1 GWN- 16 7 0.6 LE22.1 - 20 4.0 40 2.0 2 6 3.8 36 0.4 1.6 Immo-ID888888 25 7 3 .6 ?...
Calculate the missing values on the chart: Replace all the “?”
marks.
F A B C D E Calculate the missing values: replace all the ? Production and Cost Functions B C D Wage = 6 E AFC MC MPTPLAPVCI 0 0 - 16 ? 2.0 4 2.0 5 2. 3 .0 5.5 23 28 1.1 2.0 3.1 GWN- 16 7 0.6 LE22.1 - 20 4.0 40 2.0 2 6 3.8 36 0.4 1.6 Immo-ID888888 25 7 3 .6 ?...
 for question 2 use the information in picture 2 and use as
much deatil as possible.
2) With "generic" graphs, illustrate the profit maximizing quantity, price, and ATC from the solution in #1. Make sure to draw an ATC, AVC, MC, and MR curve. ATC MC MR. The table below provides the values for different types of costs. Note that FC is fixed at 3 for all . This gives VC-TC - FC Next we find AVC - VC/O and...
for question 2 use the information in picture 2 and use as
much deatil as possible.
2) With "generic" graphs, illustrate the profit maximizing quantity, price, and ATC from the solution in #1. Make sure to draw an ATC, AVC, MC, and MR curve. ATC MC MR. The table below provides the values for different types of costs. Note that FC is fixed at 3 for all . This gives VC-TC - FC Next we find AVC - VC/O and...
 Find FC, VC, TC, AFC, AVC, ATC, and MC from the following table. Capital costs $50 per unit, and two units of capital are used in the short run. Labor costs $20 per unit. 7. Total Cost Average Average Marginal Variable Cost |(MC) Fixed Units of Units of Variable Average Fixed Labor (L) Cost (FC) Cost (VC) (TC) Total Cost Output (ATC) (Q) Cost Cost (AFC) (AVC) 0 0 1 2 2 4 3 6 4 8 10
 8 9 10 11 The table below provides some information on various cost measures of a business. Use the available information to calculate the missing numbers: Q FC VC TC МC AFC AVC АТC 0 30 10 20 100 30 210 40 50 8.4 Check Next page ge 9,284. NON os The table below provides some information on various cost measures of a business. Use th missing numbers: Q FC VC TC мс AFC AVC ATC 0 30 10 20...
 Find TC, MC, AFC, AVC, and ATC from the following table. Instructions: Enter your responses rounded to two decimal places. Units (Q) VC($) TC($) MC($) | AFC($) AVC($) ATC($) FC($) 100 100 100 100 100 100 40 60 TDTT 70 85 130 (Note: Marginal costs should be interpreted as between levels of output.)
 The cost table below has enough information for you to completely fill out the blanks in the five rows (output 0, 1, 2, 3, 4). Here is a hint: at Q=4 you are told that AFC is 30. Since AFC=FC/Q, you know that FC must be 120. And, of course FC is the same for all output levels, including zero. Now you have the first column completed! FC VC TC MC AFC AVC ATC 10 168
 Quantity FC VC AFC AVC ATC MC [1] [2] [3] [4] [5] [6] [7] [8] [9] [10] [11] [12] [13] [14] [15] [16] [17] [18] [19] 30
Most questions answered within 3 hours.
-
New Air Heating and Cooling, manufactures furnaces and central
air units. The company pride itself on...
asked 53 seconds ago -
A coach uses a new technique to train gymnasts. Seven
gymnasts were randomly selected and their...
asked 1 hour ago -
While rotating the tires on your car you notice a rock [mass =
0.1 Kg] stuck...
asked 3 hours ago -
Using MARS simulator, write MIPS programs according to
the following scenarios: Receive a positive integer number...
asked 5 hours ago -
An object in front of a concave mirror has a real image that is
11.5 cm...
asked 6 hours ago -
Consider the reaction, C3 H8 + O2 --> CO2 + H2O. How many
moles of O2...
asked 7 hours ago -
You and your opponent both roll a fair die. If you both roll the
same number,...
asked 8 hours ago -
In a study of the accuracy of fast food drive-through orders,
Restaurant A had 257 accurate...
asked 8 hours ago -
Identify and describe in detail the four categories of
institutions that could be included in a...
asked 8 hours ago -
In python
class Customer:
def __init__(self, customer_id, last_name, first_name, phone_number, address):
self._customer_id = int(customer_id)
self._last_name =...
asked 8 hours ago -
What is an example of a limitation in implementing a new
ERP system and how it...
asked 8 hours ago -
In a section of 9.7cm of an artery with a radius of 2.6mm there
is a...
asked 8 hours ago