
Homework Answers


Add Answer to:
Use the following yearly rate of return valoes for Questions 1, 2, 3, and4. Market Risk-frre...
Using the data in the following table, calculate: A. Average return and standard deviation for each...
Using the data in the following table, calculate: A. Average return and standard deviation for each stock B. Covariance between the stocks C. Correlation between the stocks D. Compute average return and standard deviation of the portfolio that maintains a 50% weight in Stock A and 50% in stock B Year 2010 2011 2012 2013 2014 2015 Stock A -10.0% 20.0% 5.0% -5.0% 2.0% 9.0% Stock B 21.0% 7.0% 30.0% -3.0% -8.0% 25.0%
1. Using the data in the following table, calculate: A. Average return and standard deviation for...
 1. Using the data in the following table, calculate: A. Average return and standard deviation for each stock (4 points) B. Covariance between the stocks (2 points) C. Correlation between the stocks (2 points) D. Compute average return and standard deviation of the portfolio that maintains a 50% weight in Stock A and 50% in stock B (2 points) Year 2010 2011 2012 2013 2014 2015 Stock A -10.0% 20.0% 5.0% -5.0% 2.0% 9.0% Stock B 21.0% 7.0% 30.0% -3.0%...
The tabel is posted twice. Hopefully it is clear enough in one of those photos.
 The tabel is posted twice. Hopefully it is clear enough in one
of those photos.
Question6-10 are based on the following table Economy Prob Recession Below aV Average Above avg0 0.4 0.2 0.2 17% 3.0% 1,0% 3.0% 9.0% -6. 0% -1.0% 4,0% 8.0% 11.0% -1,0% 0.0% 1,0% 2.0% 8.0% Boom 0.1 7-What are the expected risk levels (standard deviations) of YY? a. 9.53% b, 2.60%) c. 6.02% d. None of the above 8-What are the expected coefficients of variation of...
The tabel is posted twice. Hopefully it is clear enough in one
of those photos.
Question6-10 are based on the following table Economy Prob Recession Below aV Average Above avg0 0.4 0.2 0.2 17% 3.0% 1,0% 3.0% 9.0% -6. 0% -1.0% 4,0% 8.0% 11.0% -1,0% 0.0% 1,0% 2.0% 8.0% Boom 0.1 7-What are the expected risk levels (standard deviations) of YY? a. 9.53% b, 2.60%) c. 6.02% d. None of the above 8-What are the expected coefficients of variation of...
The distribution for a population of measurements is presented in the histogram below. The mean is...
 The distribution for a population of measurements is presented in the histogram below. The mean is 3.2 and the standard deviation is 2. Suppose that five students each take a sample of ten values from the population and each student calculates the sample mean for his or her ten data values. The students draw a dotplot of their five sample means on the classroom board so that they can compare them. Which of the dotplots a -c do you think...
3. Consider Table 2. Table 2 Stock Expected Return 2 12% 6% Standard Deviation 20% 10%...
 3. Consider Table 2. Table 2 Stock Expected Return 2 12% 6% Standard Deviation 20% 10% 0.20 Correlation Coefficient (a) Consider Table 2. Compute the expected return and standard deviation of return of an equally-weighted (b) Consider Table 2. Solve for the composition, expected return and standard deviation of the minimum (c) Consider Table 2. Sketch the set of portfolios comprised of stocks 1 and 2. Be sure to include the portfolios (d) Consider Table 2. Suppose that a risk-free...
2. 3: Risk and Rates of Return: Risk in Portfolio Context Risk and Rates of Return:...
 2. 3: Risk and Rates of Return: Risk in Portfolio Context Risk
and Rates of Return: Risk in Portfolio Context The capital asset
pricing model (CAPM) explains how risk should be considered when
stocks and other assets are held . The CAPM states that any stock's
required rate of return is the risk-free rate of return plus a risk
premium that reflects only the risk remaining diversification. Most
individuals hold stocks in portfolios. The risk of a stock held in...
2. 3: Risk and Rates of Return: Risk in Portfolio Context Risk
and Rates of Return: Risk in Portfolio Context The capital asset
pricing model (CAPM) explains how risk should be considered when
stocks and other assets are held . The CAPM states that any stock's
required rate of return is the risk-free rate of return plus a risk
premium that reflects only the risk remaining diversification. Most
individuals hold stocks in portfolios. The risk of a stock held in...
A) What is the variance of each stock? B) What is the coefficient of correlation between...
 A) What is the variance of each stock?
B) What is the coefficient of correlation between stock A and
B?
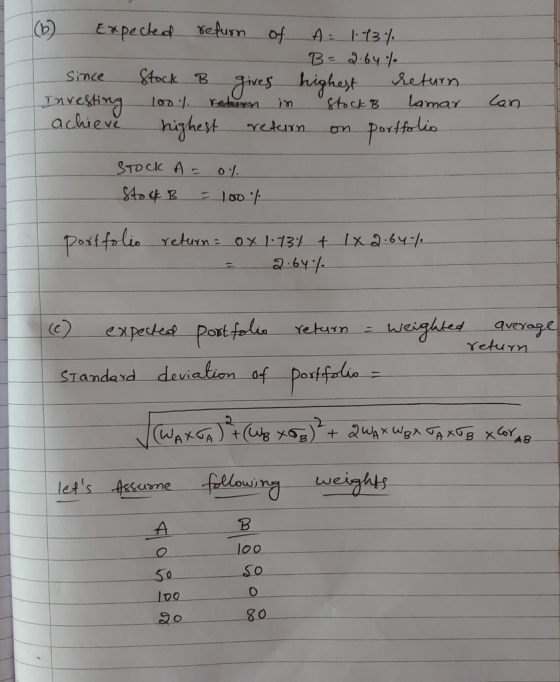
C) If you invest 80% of your money in A and 20% in B, what would
be your portfolio's expected rate of return and standard
deviation?
Consider the following probability distribution for stocks A and B: State Probability Return on Stock A Return on Stock B 0.20 5.0% 8.0% 0.15 7.0% 5.0% 0.40 -8.0% 9.0% 0.10 6.0% -15.0% 0.15 9.0%...
A) What is the variance of each stock?
B) What is the coefficient of correlation between stock A and
B?
C) If you invest 80% of your money in A and 20% in B, what would
be your portfolio's expected rate of return and standard
deviation?
Consider the following probability distribution for stocks A and B: State Probability Return on Stock A Return on Stock B 0.20 5.0% 8.0% 0.15 7.0% 5.0% 0.40 -8.0% 9.0% 0.10 6.0% -15.0% 0.15 9.0%...
Fill out the tables below of the starting material and pure product by using the given...
 Fill out the tables below of the starting material and pure
product by using the given NMR spectrums. Identify if the pure
isomer of methyl nitrobenzoate as ortho, meta, or para.
Complete the table below using your proton NMR spectrum of your starting material. Be sure to include all peaks. Note: The table is expandable. Use the structure below for the letter assignments in your table. Splitting Integration Assignment Peak (ppm) Other Notes -7.95 -7.92 0627 -787 785 7.30 751...
Fill out the tables below of the starting material and pure
product by using the given NMR spectrums. Identify if the pure
isomer of methyl nitrobenzoate as ortho, meta, or para.
Complete the table below using your proton NMR spectrum of your starting material. Be sure to include all peaks. Note: The table is expandable. Use the structure below for the letter assignments in your table. Splitting Integration Assignment Peak (ppm) Other Notes -7.95 -7.92 0627 -787 785 7.30 751...
USE EXCEL TO CALCULATE THE FREQUENCIES AS SHOWN BELOW. PLEASE PROVIDE EXCEL FORMULA USED. Frequency Distribution...
USE EXCEL TO CALCULATE THE FREQUENCIES AS SHOWN BELOW. PLEASE PROVIDE EXCEL FORMULA USED. Frequency Distribution Low High Bins Frequency -67.0 -56.6 (-67, -56.6] -56.6 -46.2 (-56.6, -46.2] -46.2 -35.8 (-46.2, -35.8] -35.8 -25.4 (-35.8, -25.4] -25.4 -15.0 (-25.4, -15] -15.0 -4.6 (-15, -4.6] -4.6 5.8 (-4.6, 5.8] 5.8 16.2 (5.8, 16.2] 16.2 26.6 (16.2, 26.6] 26.6 37.0 (26.6, 37] 37.0 47.4 (37, 47.4] 47.4 57.8 (47.4, 57.8] 57.8 68.2 (57.8, 68.2] 68.2 78.6 (68.2, 78.6] 78.6 89.0 (78.6, 89]...
analyze this NMR & IR S23 CDC13 QE-300 240 UN (43 MIL.) 10.02s, 1H), 7.716.J-2 Hz....
 analyze this NMR & IR
S23 CDC13 QE-300 240 UN (43 MIL.) 10.02s, 1H), 7.716.J-2 Hz. ) 2.0 11.5 11.0 10.5 10.0 9.5 9.0 8.5 8.0 7.5 7.0 6.5 6.0 4.0 3.5 3.0 2.5 20 15 100.5 0.0 -0.5 -1.0 -1.5 -2. 5.5 5.0 4.5 fl (ppm)
analyze this NMR & IR
S23 CDC13 QE-300 240 UN (43 MIL.) 10.02s, 1H), 7.716.J-2 Hz. ) 2.0 11.5 11.0 10.5 10.0 9.5 9.0 8.5 8.0 7.5 7.0 6.5 6.0 4.0 3.5 3.0 2.5 20 15 100.5 0.0 -0.5 -1.0 -1.5 -2. 5.5 5.0 4.5 fl (ppm)
 1. Using the data in the following table, calculate: A. Average return and standard deviation for each stock (4 points) B. Covariance between the stocks (2 points) C. Correlation between the stocks (2 points) D. Compute average return and standard deviation of the portfolio that maintains a 50% weight in Stock A and 50% in stock B (2 points) Year 2010 2011 2012 2013 2014 2015 Stock A -10.0% 20.0% 5.0% -5.0% 2.0% 9.0% Stock B 21.0% 7.0% 30.0% -3.0%...
 The tabel is posted twice. Hopefully it is clear enough in one
of those photos.
Question6-10 are based on the following table Economy Prob Recession Below aV Average Above avg0 0.4 0.2 0.2 17% 3.0% 1,0% 3.0% 9.0% -6. 0% -1.0% 4,0% 8.0% 11.0% -1,0% 0.0% 1,0% 2.0% 8.0% Boom 0.1 7-What are the expected risk levels (standard deviations) of YY? a. 9.53% b, 2.60%) c. 6.02% d. None of the above 8-What are the expected coefficients of variation of...
The tabel is posted twice. Hopefully it is clear enough in one
of those photos.
Question6-10 are based on the following table Economy Prob Recession Below aV Average Above avg0 0.4 0.2 0.2 17% 3.0% 1,0% 3.0% 9.0% -6. 0% -1.0% 4,0% 8.0% 11.0% -1,0% 0.0% 1,0% 2.0% 8.0% Boom 0.1 7-What are the expected risk levels (standard deviations) of YY? a. 9.53% b, 2.60%) c. 6.02% d. None of the above 8-What are the expected coefficients of variation of...
 The distribution for a population of measurements is presented in the histogram below. The mean is 3.2 and the standard deviation is 2. Suppose that five students each take a sample of ten values from the population and each student calculates the sample mean for his or her ten data values. The students draw a dotplot of their five sample means on the classroom board so that they can compare them. Which of the dotplots a -c do you think...
 3. Consider Table 2. Table 2 Stock Expected Return 2 12% 6% Standard Deviation 20% 10% 0.20 Correlation Coefficient (a) Consider Table 2. Compute the expected return and standard deviation of return of an equally-weighted (b) Consider Table 2. Solve for the composition, expected return and standard deviation of the minimum (c) Consider Table 2. Sketch the set of portfolios comprised of stocks 1 and 2. Be sure to include the portfolios (d) Consider Table 2. Suppose that a risk-free...
 2. 3: Risk and Rates of Return: Risk in Portfolio Context Risk
and Rates of Return: Risk in Portfolio Context The capital asset
pricing model (CAPM) explains how risk should be considered when
stocks and other assets are held . The CAPM states that any stock's
required rate of return is the risk-free rate of return plus a risk
premium that reflects only the risk remaining diversification. Most
individuals hold stocks in portfolios. The risk of a stock held in...
2. 3: Risk and Rates of Return: Risk in Portfolio Context Risk
and Rates of Return: Risk in Portfolio Context The capital asset
pricing model (CAPM) explains how risk should be considered when
stocks and other assets are held . The CAPM states that any stock's
required rate of return is the risk-free rate of return plus a risk
premium that reflects only the risk remaining diversification. Most
individuals hold stocks in portfolios. The risk of a stock held in...
 A) What is the variance of each stock?
B) What is the coefficient of correlation between stock A and
B?
C) If you invest 80% of your money in A and 20% in B, what would
be your portfolio's expected rate of return and standard
deviation?
Consider the following probability distribution for stocks A and B: State Probability Return on Stock A Return on Stock B 0.20 5.0% 8.0% 0.15 7.0% 5.0% 0.40 -8.0% 9.0% 0.10 6.0% -15.0% 0.15 9.0%...
A) What is the variance of each stock?
B) What is the coefficient of correlation between stock A and
B?
C) If you invest 80% of your money in A and 20% in B, what would
be your portfolio's expected rate of return and standard
deviation?
Consider the following probability distribution for stocks A and B: State Probability Return on Stock A Return on Stock B 0.20 5.0% 8.0% 0.15 7.0% 5.0% 0.40 -8.0% 9.0% 0.10 6.0% -15.0% 0.15 9.0%...
 Fill out the tables below of the starting material and pure
product by using the given NMR spectrums. Identify if the pure
isomer of methyl nitrobenzoate as ortho, meta, or para.
Complete the table below using your proton NMR spectrum of your starting material. Be sure to include all peaks. Note: The table is expandable. Use the structure below for the letter assignments in your table. Splitting Integration Assignment Peak (ppm) Other Notes -7.95 -7.92 0627 -787 785 7.30 751...
Fill out the tables below of the starting material and pure
product by using the given NMR spectrums. Identify if the pure
isomer of methyl nitrobenzoate as ortho, meta, or para.
Complete the table below using your proton NMR spectrum of your starting material. Be sure to include all peaks. Note: The table is expandable. Use the structure below for the letter assignments in your table. Splitting Integration Assignment Peak (ppm) Other Notes -7.95 -7.92 0627 -787 785 7.30 751...
 analyze this NMR & IR
S23 CDC13 QE-300 240 UN (43 MIL.) 10.02s, 1H), 7.716.J-2 Hz. ) 2.0 11.5 11.0 10.5 10.0 9.5 9.0 8.5 8.0 7.5 7.0 6.5 6.0 4.0 3.5 3.0 2.5 20 15 100.5 0.0 -0.5 -1.0 -1.5 -2. 5.5 5.0 4.5 fl (ppm)
analyze this NMR & IR
S23 CDC13 QE-300 240 UN (43 MIL.) 10.02s, 1H), 7.716.J-2 Hz. ) 2.0 11.5 11.0 10.5 10.0 9.5 9.0 8.5 8.0 7.5 7.0 6.5 6.0 4.0 3.5 3.0 2.5 20 15 100.5 0.0 -0.5 -1.0 -1.5 -2. 5.5 5.0 4.5 fl (ppm)
Most questions answered within 3 hours.
-
Our ability to see distinct edges as well as our errors in
contrast perceptions (e.g., seeing...
asked 17 minutes ago -
Two buckets of mass 17.1 kg and 11.3 kg are attached to the ends
of a...
asked 10 minutes ago -
A laser used in LASIK eye surgery produces 50 pulses per second.
The wavelength is 192...
asked 7 minutes ago -
Smith Inc. recently reported operating income of $2.75 million,
depreciation of $1.20 million, and had a...
asked 8 minutes ago -
A
nurse is trying to understand the structure and chain of command of
a healthcare organization....
asked 10 minutes ago -
A company is interested in estimating the costs of lunch
in their cafeteria. After surveying employees,...
asked 14 minutes ago -
A woman expends 94 kJ of energy in walking a kilometer. The
energy is supplied by...
asked 25 minutes ago -
you want to measure the gravitational acceleration at your
location. since g does not vary significantly...
asked 31 minutes ago -
Aside from commercial tools that are specifically geared toward
TAR/PC( Technology-Assisted Review), are there potential
alternative...
asked 33 minutes ago -
the period of a pendulum on earth is 5 seconds. what will be the
period of...
asked 49 minutes ago -
The
act of turning media against itself, such as flash mobs and
billboard is called
a....
asked 44 minutes ago -
A set of length measurements are obtained with the values 165.6
± 0.3, 165.1± 0.4,166.4± 1.0,...
asked 46 minutes ago