Calculate revenue. Revenue is the quantity sold times the price
for the product. The quantity sold will be the smaller of the
quantity supplied or the quantity demanded. (You can't sell more
than you are willing to make even if the market demands a higher
quantity. Likewise you can't sell more than is demanded even if you
are willing to supply more than the quantity demanded.) You will
need to calculate which of these values is smaller because quantity
demanded will be smaller than quantity supplied for some prices,
but not others. 
Homework Answers
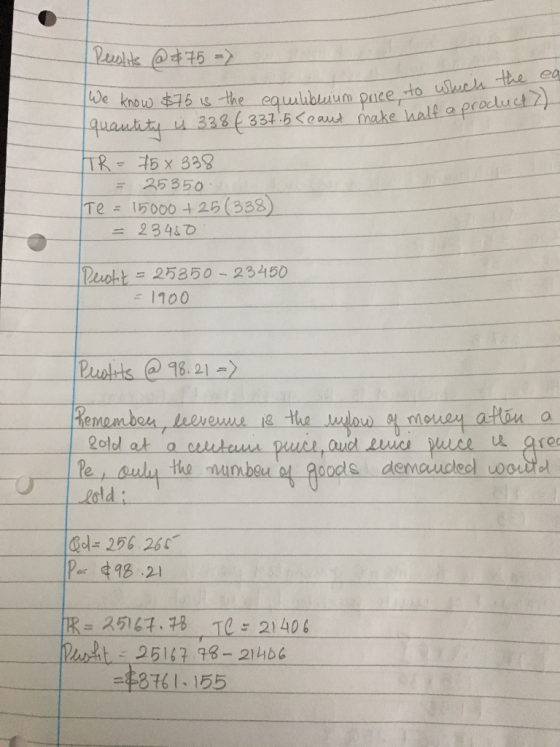
Referring to "You will need to calculate which of these values is smaller because quantity demanded will be smaller than quantity supplied for some prices, but not others." The difference between the quantity demand and the quantity supplied is referred to as the shortage or surplus at the given price.
In the picture below is a detailed solution for the entire sheet:

Add Answer to:
Calculate revenue. Revenue is the quantity sold times the price
for the product. The quantity sold...
Suppose the following table represents the market demand and supply: Price per apple (P) Quantity demanded...
 Suppose the following table represents the market demand and supply: Price per apple (P) Quantity demanded ( $2 $4.5 $8 Quantity supplied (Q) 10 35 70 64 16 a (10 points) Calculate the linear demand function: Q-a -bP. Draw the linear demand in a graph with price in the vertical axis and quantity demanded in the horizontal axis. Label all points including the intercept terms. Calculate the slope of the linear demand function What is the economic meaning of the...
Suppose that the price elasticity of demand of a good is -3. Its demand is _________...
Suppose that the price elasticity of demand of a good is -3. Its demand is _________ and the percentage change in its quantity demanded is ________ than the percentage change in its price. A. Elastic: Smaller B. Elastic: Greater C. Inelastic: Smaller D. Inelastic: Greater Which of the following is not a determinant of the price elasticity of demand? A. Availability of substitutes B. Degree of necessity C. Cost relative to income D. Availability of inputs With a(n) ______ demand,...
In market equilibrium, at the equilibrium price and equilibrium quantity, O A. both the quantity demanded...
 In market equilibrium, at the equilibrium price and equilibrium quantity, O A. both the quantity demanded equals the quantity supplied and demand equals supply O B. demand is not greater than supply O C. demand equals supply O D. the quantity demanded equals the quantity supplied and equals the quantity bought and sold
If a monopolist practices perfect price discrimination, then it will have a. a greater total revenue...
 If a monopolist practices perfect price discrimination, then it will have a. a greater total revenue and sell a greater output than if it were not practicing price discrimination. b. a smaller total revenue and sell a smaller output than if it were not practicing price discrimination. c. the same total revenue but sell a larger output than if it were not practicing price discrimination. d. the same total revenue but sell a smaller output than if it were not...
5. a) What are the determinants of Supply? b) What happened to supply curve and equilibrium price and quantity when...
 5. a) What are the determinants of Supply? b) What happened to supply curve and equilibrium price and quantity when Government provides subsidy to corn grower. Show graphically and explain by using 4-steps Process. B. Multiple choice questions: 1. At equilibrium price quantity demanded is a greater than quantity supplied b. equal to quantity supplied c. smaller than quantity supplied 2. When demand declines and supply stay the same a. equilibrium quantity rises b. equilibrium quantity declines c. equilibrium quantity...
Price Quantity Demanded 1) The above table shows Jeff's demand schedule for coffee per week. Use...
 Price Quantity Demanded 1) The above table shows Jeff's demand schedule for coffee per week. Use the table to draw Jeff's demand curve for coffee. Make sure to label the axes. Price Quantity Demanded 6 | 9 112 2) The above table shows Lorissa's demand schedule for coffee per week. Use the table to draw Lorissa's demand curve for coffee. Make sure to label the axes. Price Quantity Demanded 3) Use the space above the draw the market demand curve...
9. A tax on a product A) has no impact on quantity demanded B) always decreases...
 9. A tax on a product A) has no impact on quantity demanded B) always decreases quantity demanded more than quantity supplied. C) creates a difference between the price paid by the buyer and the price received by the seller D) usually has a negligible burden 10. Other things constant, when demand is price inelastic an increase in A) the price leads to lower total revenue B) total revenue means that quality will improve C) total revenue leads to a...
12. A market is said to be in equilibrium when: A Quantity demanded equals quantity supplied...
 12. A market is said to be in equilibrium when: A Quantity demanded equals quantity supplied B. Production costs equal revenues from sale of the output C. The number of sellers equals the number of buyers D. People's needs are fully met 13. At the equilibrium prices: A. There are shortages but no surpluses B. There are surpluses but no shortages C. The economic problem of scarcity is no longer relevant D. There are no shortages or surpluses 14. An...
This problem involves solving demand and supply equations todetermine equilibrium Price and Quantity and then...
This problem involves solving demand and supply equations to determine equilibrium Price and Quantity and then illustrating them graphically.Consider a demand curve of the form : QD= -3P + 45 where QD is the quantity demanded and P is the price of the good.The supply curve for the same good is: QS= P-5 where QS is the quantity supplied at price, P. Solve for equilibrium Price (P*) and Quantity (Q*). Please set up the problem and underline your answers below....
Use the graph to the right for a monopoly to answer the questions 4.8 What quantity will the mono...
 Use the graph to the right for a monopoly to answer the questions 4.8 What quantity will the monopoly produce, and what price will the monopoly charge? MC 4.0 3.6 5 3.2 a 2.8 2.4 o 2.0 The monopoly will produce units and charge $L per unit. (Enter numeric responses using real numbers rounded to two decimal places.) ATC Suppose the government decides to regulate this monopoly and imposes a price ceiling of $2.40 (in other words, the monopoly can...
 Suppose the following table represents the market demand and supply: Price per apple (P) Quantity demanded ( $2 $4.5 $8 Quantity supplied (Q) 10 35 70 64 16 a (10 points) Calculate the linear demand function: Q-a -bP. Draw the linear demand in a graph with price in the vertical axis and quantity demanded in the horizontal axis. Label all points including the intercept terms. Calculate the slope of the linear demand function What is the economic meaning of the...
 In market equilibrium, at the equilibrium price and equilibrium quantity, O A. both the quantity demanded equals the quantity supplied and demand equals supply O B. demand is not greater than supply O C. demand equals supply O D. the quantity demanded equals the quantity supplied and equals the quantity bought and sold
 If a monopolist practices perfect price discrimination, then it will have a. a greater total revenue and sell a greater output than if it were not practicing price discrimination. b. a smaller total revenue and sell a smaller output than if it were not practicing price discrimination. c. the same total revenue but sell a larger output than if it were not practicing price discrimination. d. the same total revenue but sell a smaller output than if it were not...
 5. a) What are the determinants of Supply? b) What happened to supply curve and equilibrium price and quantity when Government provides subsidy to corn grower. Show graphically and explain by using 4-steps Process. B. Multiple choice questions: 1. At equilibrium price quantity demanded is a greater than quantity supplied b. equal to quantity supplied c. smaller than quantity supplied 2. When demand declines and supply stay the same a. equilibrium quantity rises b. equilibrium quantity declines c. equilibrium quantity...
 Price Quantity Demanded 1) The above table shows Jeff's demand schedule for coffee per week. Use the table to draw Jeff's demand curve for coffee. Make sure to label the axes. Price Quantity Demanded 6 | 9 112 2) The above table shows Lorissa's demand schedule for coffee per week. Use the table to draw Lorissa's demand curve for coffee. Make sure to label the axes. Price Quantity Demanded 3) Use the space above the draw the market demand curve...
 9. A tax on a product A) has no impact on quantity demanded B) always decreases quantity demanded more than quantity supplied. C) creates a difference between the price paid by the buyer and the price received by the seller D) usually has a negligible burden 10. Other things constant, when demand is price inelastic an increase in A) the price leads to lower total revenue B) total revenue means that quality will improve C) total revenue leads to a...
 12. A market is said to be in equilibrium when: A Quantity demanded equals quantity supplied B. Production costs equal revenues from sale of the output C. The number of sellers equals the number of buyers D. People's needs are fully met 13. At the equilibrium prices: A. There are shortages but no surpluses B. There are surpluses but no shortages C. The economic problem of scarcity is no longer relevant D. There are no shortages or surpluses 14. An...
 Use the graph to the right for a monopoly to answer the questions 4.8 What quantity will the monopoly produce, and what price will the monopoly charge? MC 4.0 3.6 5 3.2 a 2.8 2.4 o 2.0 The monopoly will produce units and charge $L per unit. (Enter numeric responses using real numbers rounded to two decimal places.) ATC Suppose the government decides to regulate this monopoly and imposes a price ceiling of $2.40 (in other words, the monopoly can...
Most questions answered within 3 hours.
-
A turbine is spinning freely at 3750 rpm. It takes 10 min to
coast to a...
asked 3 seconds from now -
home / study / business / operations management / operations
management questions and answers / eastman...
asked 2 minutes ago -
Q1. In a DC machine, if the field winding is replaced by
permanent magnets, can the...
asked 3 minutes ago -
a.) How is a monopolistic firm different from a perfectly
competitive firm? Which firm will have...
asked 22 minutes ago -
The following reagents are available:
Reagent 1: pKa = 5
Reagent 2: pKa = 6.75
Reagent...
asked 21 minutes ago -
A company has entered into a business agreement with a business
partner for managed human resources...
asked 40 minutes ago -
You have been asked to develop a new line of organic skincare
products. Spend time with...
asked 1 hour ago -
Summerdahl Resort's common stock is currently trading at $37 a
share. The stock is expected to...
asked 1 hour ago -
To an economist, the field of industrial organization answers
which of the following questions?
asked 1 hour ago -
How could meeting industry expectations, propel managers into
challenging and possible conflict of interest situations? How...
asked 2 hours ago -
You have been married to your spouse for 10 years. You have two
small children (ages...
asked 4 hours ago -
Spiderman makes a leap from one building to
another. He starts on one building that is...
asked 4 hours ago