
Homework Answers
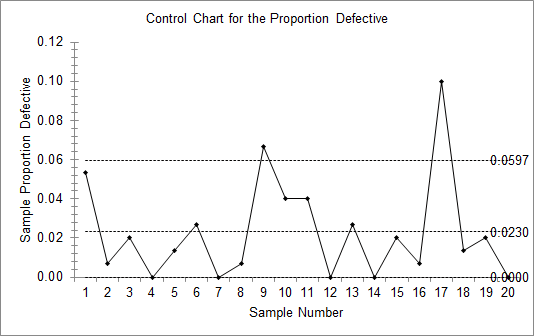
Using Excel<data<megastat<Quality control charts<proportion non conforming<sample size<150
The output is as follows:
| Quality Control Process Charts | |||||||
| Sample size | 150 | ||||||
| Number of samples | 20 | ||||||
| Proportion defective | |||||||
| Upper Control Limit, UCL | 0.0597 | ||||||
| Center | 0.0230 | ||||||
| Lower Control Limit, LCL | 0.0000 | ||||||
Question: Construct a fraction nonconforming control chart (p- chart) for these data.
Answer:

Please do the comment for any doubt or clarification. Thank You!
Add Answer to:
2- The number of nonconforming switches in Number of Number of samples of size 150 are...
Part 3 [35 Marks 3- The number of nonconforming switches in samples of size 75 are...
 Part 3 [35 Marks 3- The number of nonconforming switches in samples of size 75 are shown in Table 3. [20 Marks] Table 3 Number of Nonconforming Assemblies Number of Sample Nonconforming Number Sample Number Assemblies 6 7 11 1 15 12 2 0 13 1 3 9 14 3 4 5 15 6 5 1 16 8 4 17 10 7 5 18 5 7 19 2 9 12 20 7 10 (a) Construct a fraction nonconforming control chart...
Assignment #7 Question 3 The dats found in the table below ghe the number of non-conformirg beari...
 Assignment #7 Question 3 The dats found in the table below ghe the number of non-conformirg bearing and seal assemblies in samples of n 100 Construct a fraction nonconforming control chart for these p-chart f any point plot out ef control, assume that assignable causes can be found and determine the revised control Imits. Nusber of
Assignment #7 Question 3 The dats found in the table below ghe the number of non-conformirg bearing and seal assemblies in samples of n...
Assignment #7 Question 3 The dats found in the table below ghe the number of non-conformirg bearing and seal assemblies in samples of n 100 Construct a fraction nonconforming control chart for these p-chart f any point plot out ef control, assume that assignable causes can be found and determine the revised control Imits. Nusber of
Assignment #7 Question 3 The dats found in the table below ghe the number of non-conformirg bearing and seal assemblies in samples of n...
Chapter 7 Table below contains data on examination of medical insurance claims. Every day 50 claims...
Chapter 7 Table below contains data on examination of medical insurance claims. Every day 50 claims were examined. Day Number Nonconforming 1 0 2 3 3 4 4 6 5 5 6 2 7 8 8 9 9 4 10 2 11 6 12 4 13 8 14 0 15 7 16 20 17 6 18 1 19 5 20 7 Set up the fraction nonconforming control chart (p-chart) for this process. Plot the preliminary data in the above table...
5. The bearing manufacturing company wants to stablish a proportion of nonconforming control char...
 quality control
5. The bearing manufacturing company wants to stablish a proportion of nonconforming control chart for the ball bearing ball diameters. After taking 20 samples of size 100 each, the total number of nonconforming found was 110. Find the center line and the upper and lower limits of a control chart for the fraction of nonconforming for this process
5. The bearing manufacturing company wants to stablish a proportion of nonconforming control chart for the ball bearing ball diameters....
quality control
5. The bearing manufacturing company wants to stablish a proportion of nonconforming control chart for the ball bearing ball diameters. After taking 20 samples of size 100 each, the total number of nonconforming found was 110. Find the center line and the upper and lower limits of a control chart for the fraction of nonconforming for this process
5. The bearing manufacturing company wants to stablish a proportion of nonconforming control chart for the ball bearing ball diameters....
The dataset below is the observed number of defects from inspecting 25 successive wafers each containing...
 The dataset below is the observed number of defects from inspecting 25 successive wafers each containing n= 100 chips. Here the wafer is the inspection unit. (a) Create the appropriate control chart to control the data. (b) From the control chart, would you conclude that the process is in statistical control? (c) If any out of control points by Western Electric runs rule 1 are observed, assume they have assignable causes and can be omitted from control limit estimates. Create...
capabili fro of å companu hend theng up the exact control limis ample sizhart by setiso,...
 capabili fro of å companu hend theng up the exact control limis ample sizhart by setiso, assuming special causes te from the output Table 8-23 shows the sample the for each sample. Construct a p-chart by setin sample. Are any samples out of control? If so, as centerline and control limits ns are taken nle size and the number of nonconf by setting up the exact control Table 8-2stle Construct TABLE 8-22 Number Bills with Errors Sampled Observation Errors Obsenation...
part c Below table contains data on examination of medical insurance claims. Every day 50 claims...
 part c
Below table contains data on examination of medical insurance claims. Every day 50 claims were examined. Medical Insurance Claim Data Day Number Nonconforming Day Number Nonconforming 2 4 6 14 22 55 1151 62 1620 7 170 8 HT a) (15 points) Set up the fraction nonconforming control chart for this process. Plot the preliminary data in table on the chart. Is the process in statistical control? b) (10 points] Assume that assignable causes can be found for...
part c
Below table contains data on examination of medical insurance claims. Every day 50 claims were examined. Medical Insurance Claim Data Day Number Nonconforming Day Number Nonconforming 2 4 6 14 22 55 1151 62 1620 7 170 8 HT a) (15 points) Set up the fraction nonconforming control chart for this process. Plot the preliminary data in table on the chart. Is the process in statistical control? b) (10 points] Assume that assignable causes can be found for...
Using Minitab, solve the following problem. A process that produces parts for auto-mobile turbocharger wheels is...
Using Minitab, solve the following problem. A process that produces parts for auto-mobile turbocharger wheels is to be controlled though the use of a fraction nonconforming chart. Initially, one sample of size 100 is taken each day for 20 days, and the results shown in table are observed Day Nonconforming units Day Nonconforming units 1 3 11 2 2 2 12 4 3 4 13 1 4 2 14 3 5 5 15 6 6 2 16 0 7 1...
2- A process is controlled with a fraction nonconforming control chart with 3-sigma limits, n-100, UCL=0.161,...
 2- A process is controlled with a fraction nonconforming control chart with 3-sigma limits, n-100, UCL=0.161, CL:0.08, and LCL=0·Find the equivalent control chart for the number nonconforming.
2. (20 points) A controlled through the use of a fraction nonconforming chart. Initially, one sample of size taken each day for 10 days, and the results shown in following table are observed. (a)...
 2. (20 points) A controlled through the use of a fraction nonconforming chart. Initially, one sample of size taken each day for 10 days, and the results shown in following table are observed. (a) Establish a control chart to monitor future production. (b) Apply Western Electric Rules to these charts. Is the process in statistical control? process that produces titanium forgings for automobile turbocharger wheels is to be 200 i Day Nonconforming Units 14 15 6 7 8 14 5...
 Part 3 [35 Marks 3- The number of nonconforming switches in samples of size 75 are shown in Table 3. [20 Marks] Table 3 Number of Nonconforming Assemblies Number of Sample Nonconforming Number Sample Number Assemblies 6 7 11 1 15 12 2 0 13 1 3 9 14 3 4 5 15 6 5 1 16 8 4 17 10 7 5 18 5 7 19 2 9 12 20 7 10 (a) Construct a fraction nonconforming control chart...
 Assignment #7 Question 3 The dats found in the table below ghe the number of non-conformirg bearing and seal assemblies in samples of n 100 Construct a fraction nonconforming control chart for these p-chart f any point plot out ef control, assume that assignable causes can be found and determine the revised control Imits. Nusber of
Assignment #7 Question 3 The dats found in the table below ghe the number of non-conformirg bearing and seal assemblies in samples of n...
Assignment #7 Question 3 The dats found in the table below ghe the number of non-conformirg bearing and seal assemblies in samples of n 100 Construct a fraction nonconforming control chart for these p-chart f any point plot out ef control, assume that assignable causes can be found and determine the revised control Imits. Nusber of
Assignment #7 Question 3 The dats found in the table below ghe the number of non-conformirg bearing and seal assemblies in samples of n...
 quality control
5. The bearing manufacturing company wants to stablish a proportion of nonconforming control chart for the ball bearing ball diameters. After taking 20 samples of size 100 each, the total number of nonconforming found was 110. Find the center line and the upper and lower limits of a control chart for the fraction of nonconforming for this process
5. The bearing manufacturing company wants to stablish a proportion of nonconforming control chart for the ball bearing ball diameters....
quality control
5. The bearing manufacturing company wants to stablish a proportion of nonconforming control chart for the ball bearing ball diameters. After taking 20 samples of size 100 each, the total number of nonconforming found was 110. Find the center line and the upper and lower limits of a control chart for the fraction of nonconforming for this process
5. The bearing manufacturing company wants to stablish a proportion of nonconforming control chart for the ball bearing ball diameters....
 The dataset below is the observed number of defects from inspecting 25 successive wafers each containing n= 100 chips. Here the wafer is the inspection unit. (a) Create the appropriate control chart to control the data. (b) From the control chart, would you conclude that the process is in statistical control? (c) If any out of control points by Western Electric runs rule 1 are observed, assume they have assignable causes and can be omitted from control limit estimates. Create...
 capabili fro of å companu hend theng up the exact control limis ample sizhart by setiso, assuming special causes te from the output Table 8-23 shows the sample the for each sample. Construct a p-chart by setin sample. Are any samples out of control? If so, as centerline and control limits ns are taken nle size and the number of nonconf by setting up the exact control Table 8-2stle Construct TABLE 8-22 Number Bills with Errors Sampled Observation Errors Obsenation...
 part c
Below table contains data on examination of medical insurance claims. Every day 50 claims were examined. Medical Insurance Claim Data Day Number Nonconforming Day Number Nonconforming 2 4 6 14 22 55 1151 62 1620 7 170 8 HT a) (15 points) Set up the fraction nonconforming control chart for this process. Plot the preliminary data in table on the chart. Is the process in statistical control? b) (10 points] Assume that assignable causes can be found for...
part c
Below table contains data on examination of medical insurance claims. Every day 50 claims were examined. Medical Insurance Claim Data Day Number Nonconforming Day Number Nonconforming 2 4 6 14 22 55 1151 62 1620 7 170 8 HT a) (15 points) Set up the fraction nonconforming control chart for this process. Plot the preliminary data in table on the chart. Is the process in statistical control? b) (10 points] Assume that assignable causes can be found for...
 2- A process is controlled with a fraction nonconforming control chart with 3-sigma limits, n-100, UCL=0.161, CL:0.08, and LCL=0·Find the equivalent control chart for the number nonconforming.
 2. (20 points) A controlled through the use of a fraction nonconforming chart. Initially, one sample of size taken each day for 10 days, and the results shown in following table are observed. (a) Establish a control chart to monitor future production. (b) Apply Western Electric Rules to these charts. Is the process in statistical control? process that produces titanium forgings for automobile turbocharger wheels is to be 200 i Day Nonconforming Units 14 15 6 7 8 14 5...
Most questions answered within 3 hours.
-
Given the following JavaScript code, what will be displayed on
the web page?
var x =...
asked 6 minutes ago -
The cynics, skeptics, epicureans, & stoics were most
philosophies that dealt with:
a. the physical...
asked 8 minutes ago -
The hydronium ion concentration of an aqueous solution of 0.333
M trimethylamine (a weak base with...
asked 10 minutes ago -
A buffer is prepared by partially titrating 50.00 mL of 0.964 M
benzoic acid using 0,100...
asked 13 minutes ago -
For a Generalized Additive Model, what does a large
edf(empirical distribution function) value mean?
Thank you...
asked 25 minutes ago -
questions for Biology lab
An agarose gel electrophoresis assay performed with high quality
will NOT have...
asked 30 minutes ago -
A spring with spring constant 400 N/m is anchored at the bottom
of a frictionless 30^∘...
asked 33 minutes ago -
The half-life of 238U is 4.5×10⁹ yr.
Find the number of disintegrations per hour emitted by...
asked 42 minutes ago -
y[n] = x[n] - 3x[n - 1] + 4x[n - 2]
What is the transfer function...
asked 48 minutes ago -
Which one of the following statements is TRUE?
a.
An agency relationship is when someone hires...
asked 1 hour ago -
Consider the liquid phase reaction : A ---> Products which is
to take place in a...
asked 1 hour ago -
QUESTION ONE: For the following reaction, 13.4 grams of chlorine
gas are allowed to react with...
asked 1 hour ago