3. Oranges sold Price per Orange y (100s) x (cents) 6 10 4 20 5 30...
3.
|
Oranges sold |
Price per Orange |
|
y (100s) |
x (cents) |
|
6 |
10 |
|
4 |
20 |
|
5 |
30 |
|
4 |
40 |
|
3 |
50 |
|
1 |
60 |
Above are six weeks of data on the quantity of oranges sold (y) and price (x):
-
Estimate the parameters of this equation.
-
Predict the quantity of oranges sold if the price is 25 cents per orange.
-
Derive the OLS estimators for 0 and 1 in the simple regression model.
Homework Answers
For the given data on Oranges sold for each given price/Orange, set a regression equation in which the dependent variable is "Oranges sold y(100s)" and the independent variable is "Price per Orange x(cents)".
--------------------------------------------------------------------------------------------------------------------------------------------------------------
The result is:
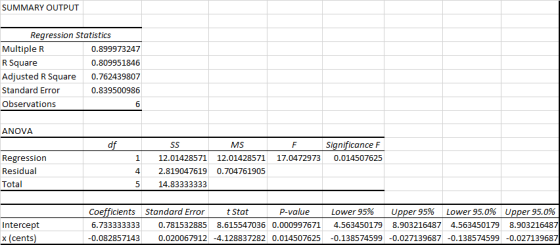
Thus, the intercept is 6.733333333 and the slope-coefficient is -0.082857143
It shall be noted that the intercept and the slope-coefficient are the parameters of the regression equation
y(100s) = 6.733333333 - 0.082857143 x
--------------------------------------------------------------------------------------------------------------------------------------------------------------
When x=25 cents
y(100s) = 6.733333333 - 0.082857143 * 25
=4.661904762
Hence, the quantity of Oranges sold is 4.661904762*100 = 466 Oranges
--------------------------------------------------------------------------------------------------------------------------------------------------------------
When price is 0 cent, the OLS estimator - intercept is 6.733333333 and expected y(100s) is 6.733333333
When price is 1 cent, the expected y(100s) is:
y(100s) = 6.733333333 - 0.082857143 * 1
=6.65047619
Add Answer to:
3.
Oranges sold
Price per Orange
y (100s)
x (cents)
6
10
4
20
5
30...
Forecast the quantity demanded when own price is $10, the price of Y is $15, the price of Z is $2...
 Forecast the quantity demanded when own price is $10, the price
of Y is $15, the price of Z is $24, and household income is
$42,000. Construct an approximately 95% confidence interval around
your estimate.
Sales
forecast:__________
Confidence interval:________ to ________
Is Y a substitute or complement for model X?
Is Z a substitute or complement to X? Is X a normal or inferior
good?
Y is ___________________
Z is ___________________
X is ___________________
Which independent variables are
statistically significant...
Forecast the quantity demanded when own price is $10, the price
of Y is $15, the price of Z is $24, and household income is
$42,000. Construct an approximately 95% confidence interval around
your estimate.
Sales
forecast:__________
Confidence interval:________ to ________
Is Y a substitute or complement for model X?
Is Z a substitute or complement to X? Is X a normal or inferior
good?
Y is ___________________
Z is ___________________
X is ___________________
Which independent variables are
statistically significant...
3. Consider the following data for two variables, x and y. 4 5 4 6 4...
 3. Consider the following data for two variables, x and y. 4 5 4 6 4 6 9 5 11 a. Does there appear to be a linear relationship between x and y? Explain. b. Develop the estimated regression equation relating x and y. c. Plot the standardized residuals versus g for the estimated regression equation developed in part (b). Do the model assumptions appear to be satisfied? Explain. d. Perform a logarithmic transformation on the dependent variable y. Develop...
1. Let X and Y be two random variables.Then Var(X+Y)=Var(X)+Var(Y)+2Couv(X,Y). True False 2. Let c be...
1. Let X and Y be two random variables.Then Var(X+Y)=Var(X)+Var(Y)+2Couv(X,Y). True False 2. Let c be a constant.Then Var(c)=c^2. True False 3. Knowing that a university has the following units/campuses: A, B , the medical school in another City. You are interested to know on average how many hours per week the university students spend doing homework. You go to A campus and randomly survey students walking to classes for one day. Then,this is a random sample representing the entire...
Given are five observations for two variables, x and y. xi 1 2 3 4 5...
 Given are five observations for two variables, x and y. xi 1 2 3 4 5 У|4751216 c. Develop the estimated regression equation by computing the the slope and the y intercept of the estimated regression line (to 1 decimal) d. Use the estimated regression equation to predict the value of y when x- 4 (to 1 decimal)
Given are five observations for two variables, x and y. xi 3 12 6 20 14...
 Given are five observations for two variables, x and
y.
xi
3
12
6
20
14
yi
50
45
55
15
15
(d) Develop the estimated regression equation by computing the
values of b0 and b1 using b1 =
Σ(xi − x)(yi − y)
Σ(xi − x)2
and b0 = y − b1x.
ŷ =
(e) Use the estimated regression equation to predict the value
of y when x = 9.
Observation 1 2 3 4 5 6 7 8...
Given are five observations for two variables, x and
y.
xi
3
12
6
20
14
yi
50
45
55
15
15
(d) Develop the estimated regression equation by computing the
values of b0 and b1 using b1 =
Σ(xi − x)(yi − y)
Σ(xi − x)2
and b0 = y − b1x.
ŷ =
(e) Use the estimated regression equation to predict the value
of y when x = 9.
Observation 1 2 3 4 5 6 7 8...
Given are five observations for two variables, x and y. xi 1 2 3 4 5...
Given are five observations for two variables, x and y. xi 1 2 3 4 5 yi 3 8 5 10 14 (d) Develop the estimated regression equation by computing the values of b0 and b1 using b1 = Σ(xi − x)(yi − y) Σ(xi − x)2 and b0 = y − b1x. ŷ = (e) Use the estimated regression equation to predict the value of y when x = 2.
x 2 6 1 3 3 y 5 10 4 8 6 Assuming that the regression...
x 2 6 1 3 3 y 5 10 4 8 6 Assuming that the regression equation is y = 2.957 + 1.214x and that the SSE = 2.5571, test to determine if the slope is not equal to zero using alpha = 0.05 a) Test Statistic T = ______ (round to two decimal places) b) Critical value(s) +/- tx/2 = _______, _______ (round to 3 decimal places)
Given are five observations for two variables, x and y. xi 1 2 3 4 5...
Given are five observations for two variables, x and y. xi 1 2 3 4 5 yi 3 7 8 11 14 Which of the following scatter diagrams accurately represents the data? 1. 2. 3. SelectScatter diagram #1Scatter diagram #2Scatter diagram #3Item 1 What does the scatter diagram indicate about the relationship between the two variables? SelectThere appears to be a linear relationship between x and yThere appears to be a nonlinear relationship between x and yItem 2 Try to...
Animal Variable X Variable Y A 3 9 B 5 8 C 4 10 D 5...
Animal Variable X Variable Y A 3 9 B 5 8 C 4 10 D 5 12 Using the data in the table above, calculate: Means for X and Y Standard Deviations for X and Y Coefficients of Variation for X and Y Correlation coefficient for X and Y Regression coefficient for X and Y Intercept Determine the regression equation
Given are five observations for two variables, x and y. xi 1 2 3 4 5...
 Given are five observations for two variables, x and
y.
xi
1
2
3
4
5
yi
3
8
4
10
15
(a)
Develop a scatter diagram for these data.
1 2 3 4 5 g 2 N to Go 4 1 2 0 1 3 4 5 6 1 2 3 (b) What does the scatter diagram developed in part (a) indicate about the relationship between the two variables? There appears to be a negative linear relationship between x...
Given are five observations for two variables, x and
y.
xi
1
2
3
4
5
yi
3
8
4
10
15
(a)
Develop a scatter diagram for these data.
1 2 3 4 5 g 2 N to Go 4 1 2 0 1 3 4 5 6 1 2 3 (b) What does the scatter diagram developed in part (a) indicate about the relationship between the two variables? There appears to be a negative linear relationship between x...
 Forecast the quantity demanded when own price is $10, the price
of Y is $15, the price of Z is $24, and household income is
$42,000. Construct an approximately 95% confidence interval around
your estimate.
Sales
forecast:__________
Confidence interval:________ to ________
Is Y a substitute or complement for model X?
Is Z a substitute or complement to X? Is X a normal or inferior
good?
Y is ___________________
Z is ___________________
X is ___________________
Which independent variables are
statistically significant...
Forecast the quantity demanded when own price is $10, the price
of Y is $15, the price of Z is $24, and household income is
$42,000. Construct an approximately 95% confidence interval around
your estimate.
Sales
forecast:__________
Confidence interval:________ to ________
Is Y a substitute or complement for model X?
Is Z a substitute or complement to X? Is X a normal or inferior
good?
Y is ___________________
Z is ___________________
X is ___________________
Which independent variables are
statistically significant...
 3. Consider the following data for two variables, x and y. 4 5 4 6 4 6 9 5 11 a. Does there appear to be a linear relationship between x and y? Explain. b. Develop the estimated regression equation relating x and y. c. Plot the standardized residuals versus g for the estimated regression equation developed in part (b). Do the model assumptions appear to be satisfied? Explain. d. Perform a logarithmic transformation on the dependent variable y. Develop...
 Given are five observations for two variables, x and y. xi 1 2 3 4 5 У|4751216 c. Develop the estimated regression equation by computing the the slope and the y intercept of the estimated regression line (to 1 decimal) d. Use the estimated regression equation to predict the value of y when x- 4 (to 1 decimal)
 Given are five observations for two variables, x and
y.
xi
3
12
6
20
14
yi
50
45
55
15
15
(d) Develop the estimated regression equation by computing the
values of b0 and b1 using b1 =
Σ(xi − x)(yi − y)
Σ(xi − x)2
and b0 = y − b1x.
ŷ =
(e) Use the estimated regression equation to predict the value
of y when x = 9.
Observation 1 2 3 4 5 6 7 8...
Given are five observations for two variables, x and
y.
xi
3
12
6
20
14
yi
50
45
55
15
15
(d) Develop the estimated regression equation by computing the
values of b0 and b1 using b1 =
Σ(xi − x)(yi − y)
Σ(xi − x)2
and b0 = y − b1x.
ŷ =
(e) Use the estimated regression equation to predict the value
of y when x = 9.
Observation 1 2 3 4 5 6 7 8...
 Given are five observations for two variables, x and
y.
xi
1
2
3
4
5
yi
3
8
4
10
15
(a)
Develop a scatter diagram for these data.
1 2 3 4 5 g 2 N to Go 4 1 2 0 1 3 4 5 6 1 2 3 (b) What does the scatter diagram developed in part (a) indicate about the relationship between the two variables? There appears to be a negative linear relationship between x...
Given are five observations for two variables, x and
y.
xi
1
2
3
4
5
yi
3
8
4
10
15
(a)
Develop a scatter diagram for these data.
1 2 3 4 5 g 2 N to Go 4 1 2 0 1 3 4 5 6 1 2 3 (b) What does the scatter diagram developed in part (a) indicate about the relationship between the two variables? There appears to be a negative linear relationship between x...
Most questions answered within 3 hours.
-
26) Briefly describe, using words or simple diagrams, the
chemiosmotic theory for coupling oxidation to phosphorylation...
asked 1 minute ago -
Suppose that XX is a random variable with mean 16 and standard
deviation 5 . Also...
asked 53 minutes ago -
Calculate the number density of argon gas at a temperature of
24C and a pressure of...
asked 4 hours ago -
Alternative
Classification
How to Estimate
Probabilities from Data? ( For continuous Attributes)
And How to generate...
asked 4 hours ago -
An explosion breaks a 20.0-kg object into three parts. The
object is initially moving at a...
asked 4 hours ago -
Calculate the approximate number of residues of Rubisco, which
is involved in carbon fixation in plants,...
asked 5 hours ago -
Other decisions about scientific claims can have a much broader
impact.ENERGYarrow-10x10.png, environment, health, security - all...
asked 6 hours ago -
I need to write a research paper and work cited about this
topic: The United States...
asked 7 hours ago -
Hello! I was wondering if I could have some help?
If the vapor pressure of carvone...
asked 7 hours ago -
An economist wants to estimate the mean per capita income (in
thousands of dollars) for a...
asked 7 hours ago -
What would be the input/output characteristic of a circuit
obtained by putting two of your 2's-complementers...
asked 7 hours ago -
In Drosophila, the transition from the syncytial blastoderm
stage to the cellular blastoderm stage is a...
asked 8 hours ago