
Homework Answers

Add Answer to:
4. A study by Professor Smith of University of South Carolina showed that students taking Business...
A study by Professor Smith of University of South Carolina showed that students taking Business Statistics...
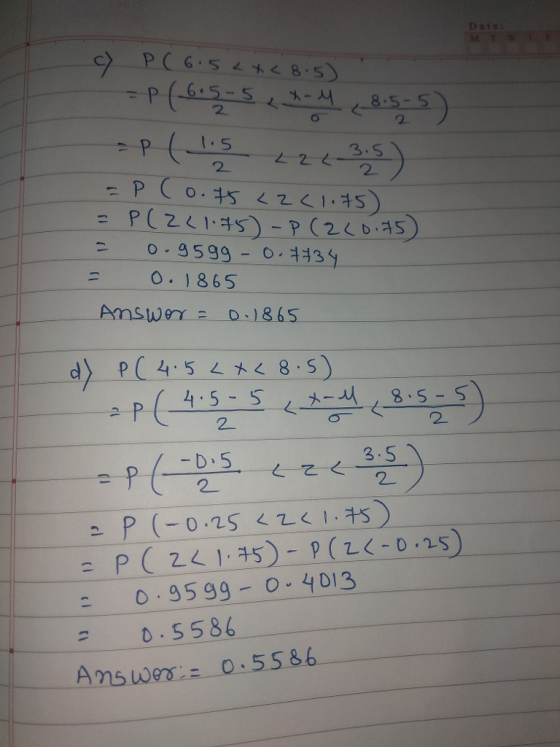
A study by Professor Smith of University of South Carolina showed that students taking Business Statistics I spent an average of 5 hours studying for the midterm exam, with a standard deviation of 2 hours and it follows the normal probability distribution. (a) Find the portion of the students who spent between 5 and 6.5 hours studying for the midterm. (b) Find the portion of the students who spent more than 6.5 hours studying for the midterm. (c) Find the...
A study by Professor Smith of University of South Carolina showed that students taking Business Statistics...
A study by Professor Smith of University of South Carolina showed that students taking Business Statistics I spent an average of 5 hours studying for the midterm exam, with a standard deviation of 2 hours and it follows the normal probability distribution. (a) Find the portion of the students who spent between 5 and 6.5 hours studying for the midterm. (b) Find the portion of the students who spent more than 6.5 hours studying for the midterm. (c) Find the...
1. Nordstrom stores conducted a study to examine the preferences of the color for women's shirts...
 1. Nordstrom stores conducted a study to examine the preferences of the color for women's shirts with the following results ge 50 or older Age less than 5 White Black Brown Yellow Blue 20 50 60 130 30 40 70 90 120 60 (a) What is the probability that a randomly selected woman like a black case the best (b) What is the probability that brown or black case is the favorite color (c) Assuming a woman is less than...
In a study of academic procrastination, the authors of a paper reported that for a sample...
In a study of academic procrastination, the authors of a paper reported that for a sample of 431 undergraduate students at a midsize public university preparing for a final exam in an introductory psychology course, the mean time spent studying for the exam was 7.34 hours and the standard deviation of study times was 3.40 hours. For purposes of this exercise, assume that it is reasonable to regard this sample as representative of students taking introductory psychology at this university....
In a study of academic procrastination, the authors of a paper reported that for a sample...
 In a study of academic procrastination, the authors of a paper reported that for a sample of 441 undergraduate students at a midsize public university preparing for a final exam in an introductory psychology course, the mean time spent studying for the exam was 7.64 hours and the standard deviation of study times was 3.50 hours. For purposes of this exercise, assume that it is reasonable to regard this sample as representative of students taking introductory psychology at this university....
QUESTIONS A sample of 150 students at a state university was taken after the final business...
 QUESTIONS A sample of 150 students at a state university was taken after the final business statistics exam to ask them whether they went partying the weekend before the final or spent the weekend studying, and whether they did well or poorly on the final. The following table contains the result. Did well in Exam Did Poorly in Exam Studying for Exam 60 15 Went Partying 22 53 a. Of those in the sample who went partying the weekend before...
A statistics professor found that the relationship between study hours (x, in hours) and exam score...
A statistics professor found that the relationship between study hours (x, in hours) and exam score (y, as percentage) is given by yˆ = 5.2x + 14. What does this indicate? If a student spends an extra hour studying, his/her predicted (average) exam score will increase by 5.2%. The actual exam score for every statistics student who studies for an extra hour will increase by exactly 5.2%. If a student spends an extra hour studying, his/her predicted (average) exam score...
What is the relationship between the amount of time statistics students study per week and their...
 What is the relationship between the amount of time statistics students study per week and their final exam scores? The results of the survey are shown below. Time Score 3 10 15 512 015 58 75 89 89 77 79 54 96 a. Find the correlation coefficient: r = Round to 2 decimal places. b. The null and alternative hypotheses for correlation are: Ho: ? - 0 H: 70 (Round to four The p-value is: decimal places) c. Use a...
What is the relationship between the amount of time statistics students study per week and their...
 What is the relationship between the amount of time statistics students study per week and their final exam scores? The results of the survey are shown below. Time Score 3 67 13 95 6 15 77 89 13 100 3 66 7 63 11 79 1 59 a. Find the correlation coefficient: r = Round to 2 decimal places. b. The null and alternative hypotheses for correlation are: Ho: ? D = 0 H: ? *0 The p-value is: (Round...
6. Professor Worth has analyzed midterm exam scores of students enrolled in his introductory economics course,...
 6. Professor Worth has analyzed midterm exam scores of students enrolled in his introductory economics course, using data on each student. He has obtained the following regression results: SCORE = 0.67 + 0.14 SAT + 0.21 STUDY + 0.07 [STUDY SAT] + e (0.22) (0.03) (0.08) (0.02) where entries in parentheses are the standard errors of the parameter estimates immediately above them; SAT = the student's SAT score, measured in units of 100 (so a score of 600 has an...
 1. Nordstrom stores conducted a study to examine the preferences of the color for women's shirts with the following results ge 50 or older Age less than 5 White Black Brown Yellow Blue 20 50 60 130 30 40 70 90 120 60 (a) What is the probability that a randomly selected woman like a black case the best (b) What is the probability that brown or black case is the favorite color (c) Assuming a woman is less than...
 In a study of academic procrastination, the authors of a paper reported that for a sample of 441 undergraduate students at a midsize public university preparing for a final exam in an introductory psychology course, the mean time spent studying for the exam was 7.64 hours and the standard deviation of study times was 3.50 hours. For purposes of this exercise, assume that it is reasonable to regard this sample as representative of students taking introductory psychology at this university....
 QUESTIONS A sample of 150 students at a state university was taken after the final business statistics exam to ask them whether they went partying the weekend before the final or spent the weekend studying, and whether they did well or poorly on the final. The following table contains the result. Did well in Exam Did Poorly in Exam Studying for Exam 60 15 Went Partying 22 53 a. Of those in the sample who went partying the weekend before...
 What is the relationship between the amount of time statistics students study per week and their final exam scores? The results of the survey are shown below. Time Score 3 10 15 512 015 58 75 89 89 77 79 54 96 a. Find the correlation coefficient: r = Round to 2 decimal places. b. The null and alternative hypotheses for correlation are: Ho: ? - 0 H: 70 (Round to four The p-value is: decimal places) c. Use a...
 What is the relationship between the amount of time statistics students study per week and their final exam scores? The results of the survey are shown below. Time Score 3 67 13 95 6 15 77 89 13 100 3 66 7 63 11 79 1 59 a. Find the correlation coefficient: r = Round to 2 decimal places. b. The null and alternative hypotheses for correlation are: Ho: ? D = 0 H: ? *0 The p-value is: (Round...
 6. Professor Worth has analyzed midterm exam scores of students enrolled in his introductory economics course, using data on each student. He has obtained the following regression results: SCORE = 0.67 + 0.14 SAT + 0.21 STUDY + 0.07 [STUDY SAT] + e (0.22) (0.03) (0.08) (0.02) where entries in parentheses are the standard errors of the parameter estimates immediately above them; SAT = the student's SAT score, measured in units of 100 (so a score of 600 has an...
Most questions answered within 3 hours.
-
The size of your Social Security benefits is determined by:
(select all that apply) Question 1...
asked 54 seconds ago -
Starch polymers are broken down by enzymes into monomers
called:
a.)maltose
b.) dextrins
c.) glucose
d.)...
asked 7 minutes ago -
How does HA (High Availability) work and name two ways it can
help an organization?
asked 9 minutes ago -
Saginaw Company is a garden products wholesale firm. In
December, Saginaw Company expects to sell 26,000...
asked 9 minutes ago -
Write a program for the management of a bookstore in java,
WITHOUT THE USE OF BOOK...
asked 10 minutes ago -
. Consider the Malthusian model and assume Y = zF (L; N) = zLN 1
,...
asked 23 minutes ago -
Reasons that BMW located their manufacturing plant in
Spartanburg South Carolina include ___________
a favorable tax...
asked 24 minutes ago -
17) Complete the following by balancing the chemical
reactions:
(a) H2(g) + N2(g) → NH3(g)
(b)...
asked 24 minutes ago -
When performing a hypothesis test for the ratio of two
population variances, the upper critical F...
asked 30 minutes ago -
You are considering buying a call option for Bernie Bros, a
company that is building a...
asked 30 minutes ago -
How are the concepts of microevolution and macroevolution
linked?
asked 40 minutes ago -
Two vectors, given in unit vector notation, are A = 5i + 4j + 3k
and...
asked 43 minutes ago