
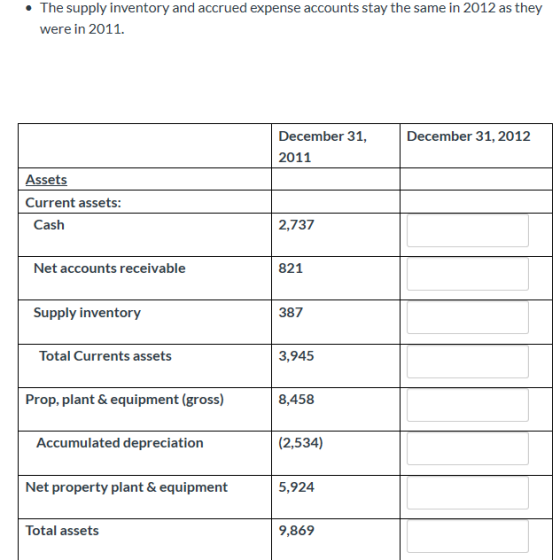

1. What was the total increase in assets between 2011 and 2012?
2. What was the hospital's 2012 net income (assume the hospital is NFP and as such does not pay out dividends? Also assume that the hospital had no charitable donations during 2012).
3. What kinds of debt and equity are used to fund the hospital's increase in assets?
4. It's great that the hospital has positive net income and that it's growing its asset base. What concerns do you have about the hospital's performance?
Homework Answers
| PARTICULARS | 2011 | 2012 |
| ASSETS | ||
| Current Assets | ||
| Cash | 2,737 | 2,637 |
| Net account receivables | 821 | 1,121 |
| Supply inventory | 387 | 387 |
| Total Current Assets | 3,945 | 4145 |
| PPE (gross) | 8,458 | 8,658 |
| Accumulated dep. | -2,534 | -2,534 |
| Net PPE | 5,924 | 6,124 |
| TOTAL ASSETS | 9,869 | 10,269 |
| LIABILITIES & NET ASSETS | ||
| Account payables | 2,145 | 2,225 |
| Accrued expenses | 929 | 929 |
| notes payable | 382 | 412 |
| Total Current laibilities | 3,456 | 3566 |
| Long-term Debt | 4,295 | 4,295 |
| Debt for building | 0 | 200 |
| Total Liabilities | 7,751 | 8,061 |
| Net Assets (unrestricted) | 2,118 | 2,118 |
| Total liabilities & net assets | 9,869 | 10,179 |
The difference of $90 can't be accounted for in known terms as the question specifies not to adjust any other account except those asked.
ANSWERS:
(1) Increase in assets = $400
(2) Net Income of 2012 can be evaluated as SURPLUS of income & expenditures of 2012.
(3) Debt of $200 led to increase in assets in 2012.
(4) CONCERNS ABOUT ITS PERFORMANCE:
- Slow debt collection period can lead to a cash-crunch in near future as a huge stock of liabilities is unpaid.
- Liabilities (short as well as long) are growing in amounts. Accounts payable must be cleared from time-to-time in order to maintain good solvency position.
Add Answer to:
1. What was the total increase in assets between 2011 and
2012?
2. What was the...
What was the total increase in assets between 2011 and 2012? What was the hospital's 2012...
 What was the total increase in assets between 2011 and 2012?
What was the hospital's 2012 net income (assume the hospital is
NFP and as such does not pay out dividends? Also assume that the
hospital had no charitable donations during 2012).
What kinds of debt and equity are used to fund the hospital's
increase in assets?
It's great that the hospital has positive net income and that
it's growing its asset base. What concerns do you have about the...
What was the total increase in assets between 2011 and 2012?
What was the hospital's 2012 net income (assume the hospital is
NFP and as such does not pay out dividends? Also assume that the
hospital had no charitable donations during 2012).
What kinds of debt and equity are used to fund the hospital's
increase in assets?
It's great that the hospital has positive net income and that
it's growing its asset base. What concerns do you have about the...
SMOLIRA GOLF 2011 and 2012 Balance Sheets Liabilities and Owners' Equity 2011 Assets 2012 2012 2011...
 SMOLIRA GOLF 2011 and 2012 Balance Sheets Liabilities and Owners' Equity 2011 Assets 2012 2012 2011 Current liabilities Current assets Cash Accounts receivable Inventory $ 23,184 12,000 11,571 $ 27,420 10,800 15,553 $ 24.255 15,235 27,155 Accounts payable Notes payable Other 24,046 12.448 25.392 $ 66,645 $ 46,755 $ 53.773 S 61.886 Total Total Long-term debt Owners' equity Common stock and paid-in surplus Accumulated retained earnings $ 80,000 $95,000 $ 40,000 219,826 $ 40,000 243,606 Fixed assets Net plant and...
Cash Equity Long-term debr Long-term investments Ner property and equipment Other assets Other long-term liabilities 1J0,000...
 Cash Equity Long-term debr Long-term investments Ner property and equipment Other assets Other long-term liabilities 1J0,000 120,000 100,000 150,000 40,000 10,000 4.5 Consider the following balance sheet: BestCare HMO Balance Sheet June 30, 2015 (in thousands) Assets Current Assets: Cash Net premiums receivable Supplies Total current assets Net property and equipment Total assets $2,737 821 387 $3,945 5,924 $9,869 Liabilities and Net Assets Accounts payable-medical services Accrued expenses $2,145 929 Notes payable Total current liabilities Long-term debt 382 Total liabilities...
Just Dew It Corporation reports the following balance sheet information for 2011 and 2012. JUST DEW...
Just Dew It Corporation reports the following balance sheet information for 2011 and 2012. JUST DEW IT CORPORATION 2011 and 2012 Balance Sheets Assets Liabilities and Owners’ Equity 2011 2012 2011 2012 Current assets Current liabilities Cash $ 9,279 $ 11,173 Accounts payable $ 41,060 $ 43,805 Accounts receivable 23,683 25,760 Notes payable 16,157 16,843 Inventory 42,636 46,915 Total $ 75,598 $ 83,848 Total $ 57,217 $ 60,648 Long-term debt $ 40,000 $ 35,000 Owners’ equity Common stock and paid-in...
2011 2012 Cash 300 400 Accounts receivable 1,000 1,400 Inventories 3,200 3,000 Current assets 4,500 4,800...
 2011 2012 Cash 300 400 Accounts receivable 1,000 1,400 Inventories 3,200 3,000 Current assets 4,500 4,800 Net fixed assets 3,800 Total assets 4,300 9,100 8,300 Notes payable 300 Accounts payable 500 Accruals Current portion of long- term debt Current liabilities 1,220 Long-term debt 4,300 Common stock ($.20 par) 1,200 Additional paid-in capital 680 Retained earnings Total liabilities and equity 8,300 Het income as reported on the 2012 Income statement) - 528 960 4,900 1,300 740 1,200 900 9,100 Depreciation as...
Jeffersonson, Inc. Balance Sheets For the years ending December 31, 2011 and 2012) 2012 500 Cash...
 Jeffersonson, Inc. Balance Sheets For the years ending December 31, 2011 and 2012) 2012 500 Cash Accounts receivable Inventory Current assets Net fixed assets Land Total assets 2011 500 2,800 9,300 12,600 48,200 11,600 72,400 2,400 9,900 12,800 61,400 12,900 87,100 1,000 1,700 Notes payable Accounts payable Accruals Current portion of LT Debt Current liabilities Long-term debt Common stock Additional paid in capital Retained earnings Total liabilities and equity 1,200 1,900 100 3,200 6,400 12,600 21,000 18,400 14,000 72,400 4,200...
Thompson, Inc. Balance Sheets For the years ending December 31, 2011 and 2012) 2012 300 Cash...
 Thompson, Inc. Balance Sheets For the years ending December 31, 2011 and 2012) 2012 300 Cash Accounts receivable Inventory Current assets Net fixed assets Total assets 2011 800 3,700 8,400 12,900 34,500 47,400 3,000 10,200 13,500 42,600 56,100 Notes payable Accounts payable Accruals Current liabilities Long-term debt Common stock Capital surplus Retained earnings Total liabilities and equity 1,000 600 1,600 10,700 6,000 18,900 10,200 47,400 1,600 800 700 3,100 10,000 8,000 24,100 10,900 56,100 In its 2011 income statement, Thompson...
Balance Sheets for the Years Ending Dec. 31, 2011 and 2012 2011 2012 Cash 300...
Balance Sheets for the Years Ending Dec. 31, 2011 and 2012 2011 2012 Cash 300 400 Accounts receivable 1,000 1,400 Inventories 3,200 3,000 Current assets 4,500 4,800 Net fixed assets 3,800 4,300 Total assets 8,300 9,100 Notes payable 400 300 Accounts payable 700 500 Accruals 50 80 Current portion of long-term debt 70 80 Current liabilities 1,220 960...
 What was the total increase in assets between 2011 and 2012?
What was the hospital's 2012 net income (assume the hospital is
NFP and as such does not pay out dividends? Also assume that the
hospital had no charitable donations during 2012).
What kinds of debt and equity are used to fund the hospital's
increase in assets?
It's great that the hospital has positive net income and that
it's growing its asset base. What concerns do you have about the...
What was the total increase in assets between 2011 and 2012?
What was the hospital's 2012 net income (assume the hospital is
NFP and as such does not pay out dividends? Also assume that the
hospital had no charitable donations during 2012).
What kinds of debt and equity are used to fund the hospital's
increase in assets?
It's great that the hospital has positive net income and that
it's growing its asset base. What concerns do you have about the...
 SMOLIRA GOLF 2011 and 2012 Balance Sheets Liabilities and Owners' Equity 2011 Assets 2012 2012 2011 Current liabilities Current assets Cash Accounts receivable Inventory $ 23,184 12,000 11,571 $ 27,420 10,800 15,553 $ 24.255 15,235 27,155 Accounts payable Notes payable Other 24,046 12.448 25.392 $ 66,645 $ 46,755 $ 53.773 S 61.886 Total Total Long-term debt Owners' equity Common stock and paid-in surplus Accumulated retained earnings $ 80,000 $95,000 $ 40,000 219,826 $ 40,000 243,606 Fixed assets Net plant and...
 Cash Equity Long-term debr Long-term investments Ner property and equipment Other assets Other long-term liabilities 1J0,000 120,000 100,000 150,000 40,000 10,000 4.5 Consider the following balance sheet: BestCare HMO Balance Sheet June 30, 2015 (in thousands) Assets Current Assets: Cash Net premiums receivable Supplies Total current assets Net property and equipment Total assets $2,737 821 387 $3,945 5,924 $9,869 Liabilities and Net Assets Accounts payable-medical services Accrued expenses $2,145 929 Notes payable Total current liabilities Long-term debt 382 Total liabilities...
 2011 2012 Cash 300 400 Accounts receivable 1,000 1,400 Inventories 3,200 3,000 Current assets 4,500 4,800 Net fixed assets 3,800 Total assets 4,300 9,100 8,300 Notes payable 300 Accounts payable 500 Accruals Current portion of long- term debt Current liabilities 1,220 Long-term debt 4,300 Common stock ($.20 par) 1,200 Additional paid-in capital 680 Retained earnings Total liabilities and equity 8,300 Het income as reported on the 2012 Income statement) - 528 960 4,900 1,300 740 1,200 900 9,100 Depreciation as...
 Jeffersonson, Inc. Balance Sheets For the years ending December 31, 2011 and 2012) 2012 500 Cash Accounts receivable Inventory Current assets Net fixed assets Land Total assets 2011 500 2,800 9,300 12,600 48,200 11,600 72,400 2,400 9,900 12,800 61,400 12,900 87,100 1,000 1,700 Notes payable Accounts payable Accruals Current portion of LT Debt Current liabilities Long-term debt Common stock Additional paid in capital Retained earnings Total liabilities and equity 1,200 1,900 100 3,200 6,400 12,600 21,000 18,400 14,000 72,400 4,200...
 Thompson, Inc. Balance Sheets For the years ending December 31, 2011 and 2012) 2012 300 Cash Accounts receivable Inventory Current assets Net fixed assets Total assets 2011 800 3,700 8,400 12,900 34,500 47,400 3,000 10,200 13,500 42,600 56,100 Notes payable Accounts payable Accruals Current liabilities Long-term debt Common stock Capital surplus Retained earnings Total liabilities and equity 1,000 600 1,600 10,700 6,000 18,900 10,200 47,400 1,600 800 700 3,100 10,000 8,000 24,100 10,900 56,100 In its 2011 income statement, Thompson...
Most questions answered within 3 hours.
-
Kylie is a single mom with two dependent children,
Tanner, age 7 and Olivia, age 11....
asked 1 hour ago -
Phosphorous + bromine = phosphorous tribromide. If 35.0 g of
bromine are reacted and 27.9 grams...
asked 2 hours ago -
Derive the long wavelength limit of the Planck energy density
distribution
asked 2 hours ago -
Calculate the pH of each of the following solutions.
0.50 M HBr
3.1×10⁻⁴ M KOH
4.2×10⁻⁵...
asked 6 hours ago -
For the year ended December 31, Depot Max’s cost of merchandise
sold was $85,600. Inventory at the...
asked 6 hours ago -
Week 10 - Professional Memo Assignment
Professional Memo Assignment
Your mission for this week, should you...
asked 6 hours ago -
Write a Python program that stores the data for each
player on the team, and it...
asked 6 hours ago -
In
the last 3 months, mike never knows when he is going to get his
allowance...
asked 6 hours ago -
Is Ca(OH)2 a Bronsted base, Lewis base, or both? Why?
asked 6 hours ago -
1A- Why don’t voters complain about U.S. tariffs on imported
sugar?
Because sugar is only a...
asked 6 hours ago -
Cash Payback Period
Primera Banco is evaluating two capital investment proposals for
a drive-up ATM kiosk,...
asked 6 hours ago -
Create a button in Swift (Xcode) that will create a charge,
create a charge using Stripe's...
asked 6 hours ago