Use SPSS to answer the following questions. (Hint: For instructions use the SPSS Instruction Manual posted...
Use SPSS to answer the following questions. (Hint: For instructions use the SPSS Instruction Manual posted to the module as a reference for all SPSS output). Paste all SPSS output into the document below. Answer all questions fully.
- Create a new variable called WeeklySPtime. This should be TotalTimeSpent/16.
- Create a histogram for WeeklySPtime.
- Describe the shape of the distribution.
- Calculate the mean, standard deviation, median, min, and max for WeeklySPtime.
- Write a sentence or describing on how much time students spend on their study plan.
- Create a scatter plot of weeklySPtime and FinalGradePercentage.
- Does it look like there is a trend between the two? Yes/No. Explain your answer.
- Important question: Are the values calculated here statistics or parameters? Do they relate to the sample or to the population?
- Create a side-by-side boxplot of the weeklySPtime for face-to-face and online students. Compare the plots, do you see large differences between the two types of classes?
Total Time Spent listed below:
| 2758 |
| 701 |
| 384 |
| 526 |
| 529 |
| 321 |
| 1454 |
| 1684 |
| 1145 |
| 148 |
| 573 |
| 1224 |
| 2260 |
| 1626 |
| 7889 |
| 1025 |
| 2803 |
| 2519 |
| 3368 |
| 1223 |
| 453 |
| 436 |
| 699 |
| 94 |
| 274 |
| 1329 |
| 1560 |
| 1834 |
| 2174 |
| 218 |
| 858 |
| 1063 |
| 768 |
| 587 |
| 723 |
| 373 |
| 146 |
| 1354 |
| 6369 |
| 1491 |
| 1502 |
| 182 |
| 540 |
| 1735 |
| 208 |
| 251 |
| 422 |
| 5679 |
| 502 |
| 1241 |
| 560 |
| 987 |
| 1059 |
| 1086 |
| 5811 |
| 197 |
| 587 |
| 3333 |
| 2378 |
| 806 |
Homework Answers
Answer:
- Create a new variable called WeeklySPtime. This should be TotalTimeSpent/16.
- Create a histogram for WeeklySPtime.

- Describe the shape of the distribution.
The plot shows that data are positively skewed.
- Calculate the mean, standard deviation, median, min, and max for WeeklySPtime.
|
Statistics |
||
|
WeeklySPtime |
||
|
N |
Valid |
60 |
|
Missing |
0 |
|
|
Mean |
89.6135 |
|
|
Median |
62.8750 |
|
|
Std. Deviation |
99.06380 |
|
|
Minimum |
5.88 |
|
|
Maximum |
493.06 |
|
- Write a sentence or describing on how much time students spend on their study plan.
The students spend on their study plan for about 89.6 hours per week. Minimum value is 5.88 and maximum is 493.06.
- Create a scatter plot of weeklySPtime and FinalGradePercentage.

- Does it look like there is a trend between the two? Yes/No. Explain your answer.
The scatter plot shows that there is no trend. There is no pattern or no obvious relation between the two variables .
- Important question: Are the values calculated here statistics or parameters? Do they relate to the sample or to the population?
The values calculated here are based on sample, therefore statistics. They are describing the sample data.
- Create a side-by-side boxplot of the weeklySPtime for face-to-face and online students. Compare the plots, do you see large differences between the two types of classes?
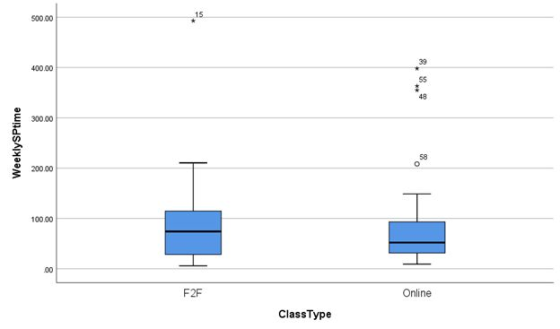
The plot shows that there is not much difference between the two types of classes.
Add Answer to:
Use SPSS to answer the following questions. (Hint: For
instructions use the SPSS Instruction Manual posted...
Most questions answered within 3 hours.
-
What are two strengths and two weaknesses of hardware,
software, and/or data?
How can the weaknesses...
asked 21 seconds from now -
A and B face the choice of working in a safe
mine at €200/wk or an...
asked 19 minutes ago -
True or false: couldnt figure out these few
- When charges are only located OUTSIDE an...
asked 28 minutes ago -
Given the following function:
int fun1(int count){
int Num ;
for (i = 0; i <...
asked 28 minutes ago -
Please submit your paper topic so that I can review it and make
any necessary suggestions...
asked 29 minutes ago -
Why are there so many theories of addiction? (Consider the
adequacy of each theory in relation...
asked 32 minutes ago -
22mL of 0.1020M Naoh is used in a titration against an unknown
1M acid (30mL). Determine...
asked 41 minutes ago -
Solve for distance using 90 db = 85 db + 20 log (20 ft/
distance)
1.8...
asked 43 minutes ago -
Aluminum is cast in an insulating ceramic mold with no
superheat. The thickness of the casting...
asked 1 hour ago -
Discuss the current status of Ulmus americana and the reasons for
it status. (answer in detail...
asked 1 hour ago -
Q3. A car moves with a constant velocity of 25m/s east with
respect to a person...
asked 1 hour ago -
If a bond currently sold at $865 with a yield to maturity of 8%
and a...
asked 1 hour ago