Please fill out the rest


Homework Answers
| Joyce Morphy | |||
| Requirement 1 | |||
| Selling Price per mile | $ 0.50 | ||
| Less : Variable cost per mile | $ (0.20) | ||
| Contribution margin per mile | $ 0.30 | ||
| Break Even = Fixed Cost / Contribution margin | |||
| $215 / $0.30 | 717 | Miles | |
| Working Note : | |||
| Calculation of Variable cost per mile using High low method : | |||
| No of Miles | Total operating costs | ||
| High | 4400 | $ 1,095.00 | |
| Low | 3300 | $ 875.00 | |
| Variable cost per mile = (1095-875)/(4400-3300) | $ 0.20 | per Mile | |
| At 4400 Miles, Total operating costs = $1095 | |||
| Fixed cost + 4400*$0.20 = $1095 | |||
| Fixed cost = 1095 - 4400*0.2 | |||
| $ 215.00 | |||
| Requirement 2 | |||
| At 4200 Miles, | |||
| Revenue | $ 2,100.00 | ||
| Less : Variable cost | $ (840.00) | ||
| Contribution margin | $ 1,260.00 | ||
| Less : Fixed cost | $ (215.00) | ||
| Net Operating income | $ 1,045.00 | ||
| Degree of Operating Leverage = Contribution Margin / Net Operating Income | |||
| $1260 / $1045 | 1.2057 | ||
| Requirement 3 | |||
| Degree of Operating Leverage = % change in Net income / % change in sales | |||
| 1.2057 = % change in net income / (25%) | |||
| % change in net income = -25%*1.2057 | -30.1425% | ||
Add Answer to:
Please fill out the rest
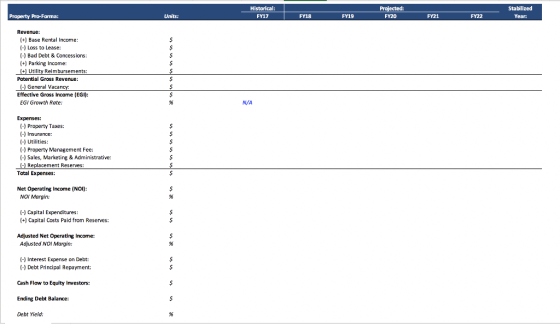
Please fill out the property pro forma (last picture)
Your investment...
Looking for the correct answer.... several have been posted and not sure which are correct or...
Looking for the correct answer.... several have been posted and not sure which are correct or all questions have not been answered Assume that you are an investment analyst preparing an analysis of an investment opportunity for a client. Your client is considering the acquisition of an apartment complex from a developer at the point in time when the apartments are ready for first occupancy. Your have developed the following information. 1) Number of units = 36 2) First year...
How to get picture 1 "Cost of Sales" and picture 2 "Net Income or Net Earnings",...
 How to get picture 1 "Cost of Sales" and picture 2 "Net Income
or Net Earnings", thank you.
February 1, 2020 February 2 2019 Year Ended February 3, 2018 Jamiary 28, 2017 January 30, 2016 3. Total Assets S S Total Liabilities Total Equity or Total Shareholders Investments Financial Statement Name as stated in the 10-K Statement of Operations Data: Net sales Gross profit Selling, general and administrative expenses Operating income (loss) 23,610.8 S 7,040.7 5.778.5 1.262.2 22,823.3 $ 6.947.5...
How to get picture 1 "Cost of Sales" and picture 2 "Net Income
or Net Earnings", thank you.
February 1, 2020 February 2 2019 Year Ended February 3, 2018 Jamiary 28, 2017 January 30, 2016 3. Total Assets S S Total Liabilities Total Equity or Total Shareholders Investments Financial Statement Name as stated in the 10-K Statement of Operations Data: Net sales Gross profit Selling, general and administrative expenses Operating income (loss) 23,610.8 S 7,040.7 5.778.5 1.262.2 22,823.3 $ 6.947.5...
I need Summary of this Paper i dont need long summary i need What methodology they used , what is the purpose of this p...
 I need Summary of this Paper i dont need long summary i need
What methodology they used , what is the purpose of this paper and
some conclusions and contributes of this paper. I need this for my
Finishing Project so i need this ASAP please ( IN 1-2-3 HOURS
PLEASE !!!)
Budgetary Policy and Economic Growth Errol D'Souza The share of capital expenditures in government expenditures has been slipping and the tax reforms have not yet improved the income...
I need Summary of this Paper i dont need long summary i need
What methodology they used , what is the purpose of this paper and
some conclusions and contributes of this paper. I need this for my
Finishing Project so i need this ASAP please ( IN 1-2-3 HOURS
PLEASE !!!)
Budgetary Policy and Economic Growth Errol D'Souza The share of capital expenditures in government expenditures has been slipping and the tax reforms have not yet improved the income...
Accounting for Business Decisions – Starbucks You are to submit an individual one to two-page report...
 Accounting for Business Decisions – Starbucks
You are to submit an individual one to two-page report answering
the following from an accounting perspective, not a
marketing/management perspective:
You are required to:
1. Of all the risks (risks are listed at the bottom) that
Starbuck’s management discloses, which one do you think could most
adversely affect the Balance Sheet and Income Statement at the
store level and why? Demonstrate your understanding by showing an
effect one on at least one of...
Accounting for Business Decisions – Starbucks
You are to submit an individual one to two-page report answering
the following from an accounting perspective, not a
marketing/management perspective:
You are required to:
1. Of all the risks (risks are listed at the bottom) that
Starbuck’s management discloses, which one do you think could most
adversely affect the Balance Sheet and Income Statement at the
store level and why? Demonstrate your understanding by showing an
effect one on at least one of...
JOHNSON & JOHNSON AND SUBSIDIARIES CONSOLIDATED STATEMENTS OF EARNINGS (Dollars and Shares in Millions Except Per...
 JOHNSON & JOHNSON AND SUBSIDIARIES CONSOLIDATED STATEMENTS OF EARNINGS (Dollars and Shares in Millions Except Per Share Amounts) (Note 1)* 2016 71,890 21,789 50.101 20,067 9.143 29 Sales to customers Cost of products sold Gross profit Selling, marketing and administrative expenses Research and development expense In-process research and development Interest income Interest expense, net of portion capitalized (Note 4) Other (income) expense, net Restructuring (Note 22) Eamings before provision for taxes on income Provision for taxes on income (Note 8)...
CASE 1-5 Financial Statement Ratio Computation Refer to Campbell Soup Company's financial Campbell Soup statements in...
 CASE 1-5 Financial Statement Ratio Computation Refer to Campbell Soup Company's financial Campbell Soup statements in Appendix A. Required: Compute the following ratios for Year 11. Liquidity ratios: Asset utilization ratios:* a. Current ratio n. Cash turnover b. Acid-test ratio 0. Accounts receivable turnover c. Days to sell inventory p. Inventory turnover d. Collection period 4. Working capital turnover Capital structure and solvency ratios: 1. Fixed assets turnover e. Total debt to total equity s. Total assets turnover f. Long-term...
 How to get picture 1 "Cost of Sales" and picture 2 "Net Income
or Net Earnings", thank you.
February 1, 2020 February 2 2019 Year Ended February 3, 2018 Jamiary 28, 2017 January 30, 2016 3. Total Assets S S Total Liabilities Total Equity or Total Shareholders Investments Financial Statement Name as stated in the 10-K Statement of Operations Data: Net sales Gross profit Selling, general and administrative expenses Operating income (loss) 23,610.8 S 7,040.7 5.778.5 1.262.2 22,823.3 $ 6.947.5...
How to get picture 1 "Cost of Sales" and picture 2 "Net Income
or Net Earnings", thank you.
February 1, 2020 February 2 2019 Year Ended February 3, 2018 Jamiary 28, 2017 January 30, 2016 3. Total Assets S S Total Liabilities Total Equity or Total Shareholders Investments Financial Statement Name as stated in the 10-K Statement of Operations Data: Net sales Gross profit Selling, general and administrative expenses Operating income (loss) 23,610.8 S 7,040.7 5.778.5 1.262.2 22,823.3 $ 6.947.5...
 I need Summary of this Paper i dont need long summary i need
What methodology they used , what is the purpose of this paper and
some conclusions and contributes of this paper. I need this for my
Finishing Project so i need this ASAP please ( IN 1-2-3 HOURS
PLEASE !!!)
Budgetary Policy and Economic Growth Errol D'Souza The share of capital expenditures in government expenditures has been slipping and the tax reforms have not yet improved the income...
I need Summary of this Paper i dont need long summary i need
What methodology they used , what is the purpose of this paper and
some conclusions and contributes of this paper. I need this for my
Finishing Project so i need this ASAP please ( IN 1-2-3 HOURS
PLEASE !!!)
Budgetary Policy and Economic Growth Errol D'Souza The share of capital expenditures in government expenditures has been slipping and the tax reforms have not yet improved the income...
 Accounting for Business Decisions – Starbucks
You are to submit an individual one to two-page report answering
the following from an accounting perspective, not a
marketing/management perspective:
You are required to:
1. Of all the risks (risks are listed at the bottom) that
Starbuck’s management discloses, which one do you think could most
adversely affect the Balance Sheet and Income Statement at the
store level and why? Demonstrate your understanding by showing an
effect one on at least one of...
Accounting for Business Decisions – Starbucks
You are to submit an individual one to two-page report answering
the following from an accounting perspective, not a
marketing/management perspective:
You are required to:
1. Of all the risks (risks are listed at the bottom) that
Starbuck’s management discloses, which one do you think could most
adversely affect the Balance Sheet and Income Statement at the
store level and why? Demonstrate your understanding by showing an
effect one on at least one of...
 JOHNSON & JOHNSON AND SUBSIDIARIES CONSOLIDATED STATEMENTS OF EARNINGS (Dollars and Shares in Millions Except Per Share Amounts) (Note 1)* 2016 71,890 21,789 50.101 20,067 9.143 29 Sales to customers Cost of products sold Gross profit Selling, marketing and administrative expenses Research and development expense In-process research and development Interest income Interest expense, net of portion capitalized (Note 4) Other (income) expense, net Restructuring (Note 22) Eamings before provision for taxes on income Provision for taxes on income (Note 8)...
 JOHNSON & JOHNSON AND SUBSIDIARIES CONSOLIDATED STATEMENTS OF EARNINGS (Dollars and Shares in Millions Except Per Share Amounts) (Note 1)* 2016 71,890 21,789 50.101 20,067 9.143 29 Sales to customers Cost of products sold Gross profit Selling, marketing and administrative expenses Research and development expense In-process research and development Interest income Interest expense, net of portion capitalized (Note 4) Other (income) expense, net Restructuring (Note 22) Eamings before provision for taxes on income Provision for taxes on income (Note 8)...
 JOHNSON & JOHNSON AND SUBSIDIARIES CONSOLIDATED STATEMENTS OF EARNINGS (Dollars and Shares in Millions Except Per Share Amounts) (Note 1)* 2016 71,890 21,789 50.101 20,067 9.143 29 Sales to customers Cost of products sold Gross profit Selling, marketing and administrative expenses Research and development expense In-process research and development Interest income Interest expense, net of portion capitalized (Note 4) Other (income) expense, net Restructuring (Note 22) Eamings before provision for taxes on income Provision for taxes on income (Note 8)...
 JOHNSON & JOHNSON AND SUBSIDIARIES CONSOLIDATED STATEMENTS OF EARNINGS (Dollars and Shares in Millions Except Per Share Amounts) (Note 1)* 2016 71,890 21,789 50.101 20,067 9.143 29 Sales to customers Cost of products sold Gross profit Selling, marketing and administrative expenses Research and development expense In-process research and development Interest income Interest expense, net of portion capitalized (Note 4) Other (income) expense, net Restructuring (Note 22) Eamings before provision for taxes on income Provision for taxes on income (Note 8)...
 JOHNSON & JOHNSON AND SUBSIDIARIES CONSOLIDATED STATEMENTS OF EARNINGS (Dollars and Shares in Millions Except Per Share Amounts) (Note 1)* 2016 71,890 21,789 50.101 20,067 9.143 29 Sales to customers Cost of products sold Gross profit Selling, marketing and administrative expenses Research and development expense In-process research and development Interest income Interest expense, net of portion capitalized (Note 4) Other (income) expense, net Restructuring (Note 22) Eamings before provision for taxes on income Provision for taxes on income (Note 8)...
 CASE 1-5 Financial Statement Ratio Computation Refer to Campbell Soup Company's financial Campbell Soup statements in Appendix A. Required: Compute the following ratios for Year 11. Liquidity ratios: Asset utilization ratios:* a. Current ratio n. Cash turnover b. Acid-test ratio 0. Accounts receivable turnover c. Days to sell inventory p. Inventory turnover d. Collection period 4. Working capital turnover Capital structure and solvency ratios: 1. Fixed assets turnover e. Total debt to total equity s. Total assets turnover f. Long-term...
Most questions answered within 3 hours.
-
The free energy change for the following reaction at 25 °C, when
[Sn2+] = 1.17 M...
asked 57 minutes ago -
An MNE is this kind of industry when competition in one country
is essentially independent of...
asked 2 hours ago -
. For this set of questions, determine what
proportion of a normal distribution is located betweeneach...
asked 3 hours ago -
A college student is employed as a door-to-door newspaper
salesman. Historical data suggests that the student...
asked 3 hours ago -
MATLAB HW 11 problem using Switch Case and Input commands
Write a script file that calculates...
asked 3 hours ago -
Considering gravitational time dilation, calculate the time that
passes in Earth’s surface while 1 hour passes...
asked 4 hours ago -
Minitab Problem: Take the Lake Hume June rainfall data and find
use the processes outlined in...
asked 5 hours ago -
X Company is trying to decide whether to continue using old
equipment to make Product A...
asked 5 hours ago -
IN PYTHON ONLY !! Program 2: Re-work
program #5 (WeeklyHours) from the previous assignment such that...
asked 5 hours ago -
The average length of time between arrivals at a turnpike
toll-booth is 26 seconds. What is...
asked 7 hours ago -
(a) A piston at 6.1 atm contains a gas that occupies a volume of
3.5 L....
asked 8 hours ago -
Please answer true or false. Words
cannot be changed or added in to make it true...
asked 8 hours ago