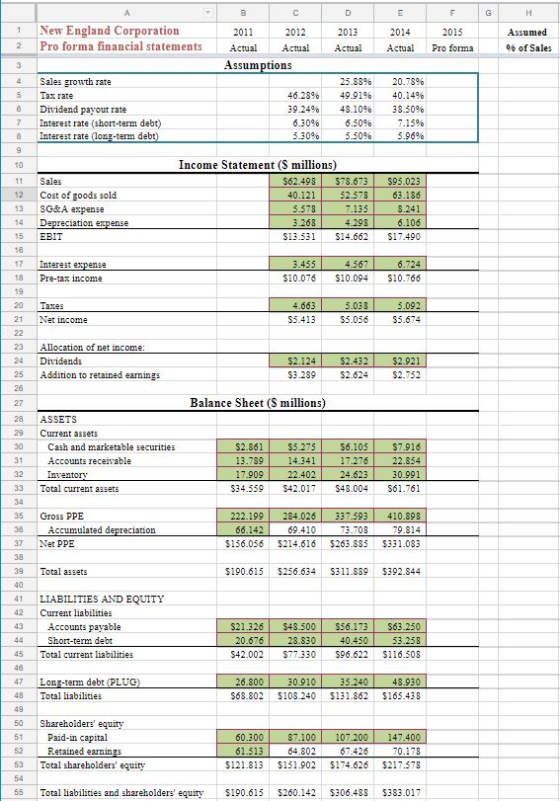
Part A: Create pro forma financial statements.
This spreadsheet is set up so that green cells contain numbers and white cells contain formulas. Follow the steps below to prepare proformas for 2015, assuming that New England Corp. will make up any funding shortfall with long-term debt, and will use any funding surplus to pay down long-term debt (i.e., let long-term debt be the plug figure).
1. As a starting point, assume that sales growth in 2015 will be equal to the average sales growth for 2013 and 2014. Enter the formula for this assumption in the Assumptions section, and then enter the formula for projected sales in 2015.
2. For all financial statement items that would be expected to vary with sales, use the historical average over the past three years of the ratio of that item to sales as a projection of the percentage of sales for 2015. I suggest that you enter these percentages in the column on the right “Assumed % of Sales”. (Hint: If you enter your formula correctly in one cell, locking in the appropriate references, then you can simply copy and paste the formula to other cells.) Having this column allows you to return and change the assumption for these items later on. For simplicity, in addition to items that typically vary as a percentage of sales, also assume that depreciation expense, Gross PPE, and short-term debt vary as a percentage of sales.
3. Fill in the 2015 forecast for each item that would be expected to vary with sales. (Again, if you enter the formula correctly, you can copy and paste it to other cells.)
4. Fill in all cells in the 2015 forecast that are just formulas (e.g., pre-tax income is just EBIT – interest expense).
5. Fill in the other items that would not be expected to vary with sales, that is, everything else except for long-term debt. Assumptions for the tax rate, dividend payout rate, and interest rates should be made above in the Assumptions section. For the tax rate and dividend payout rate assume a 2015 projection equal to the average of the previous three years. Assume that interest rates will remain the same as the previous year. Also assume no new equity will be issued in 2015.
6. Fill in long-term debt as the plug figure. This will be the balancing item that makes assets = liabilities + equity, but don’t enter the formula as total assets – (total liabilities + equity) or you will get a circular reference (one that can’t be remedied with iterative calculation). Instead, you need to make the formula be total assets – current liabilities – total equity. This will balance the balance sheet and not be circular.
Q1: Under the assumptions outlined above, what level of long-term debt will be required by New England Corporation in 2015?_________________
Q2: What is projected net income for New England in 2015? _________________
Homework Answers

Formula sheet
| New England Corporation | 2011 | 2012 | 2013 | 2014 | 2015 | Assumed | ||
| Pro forma financial statements | Actual | Actual | Actual | Actual | Proforma | % of Sales | ||
| Assumptions | ||||||||
| Sales growth rate | 0.2588 | 0.2078 | =AVERAGE(D4:E4) | |||||
| Tax rate | 0.4628 | 0.4991 | 0.4014 | =AVERAGE(C5:E5) | ||||
| Dividend payout rate | 0.3924 | 0.481 | 0.385 | =AVERAGE(C6:E6) | ||||
| Interest rate (Short-term debt) | 0.063 | 0.065 | 0.0715 | =E7 | ||||
| Interest rate (Long-term debt) | 0.053 | 0.055 | 0.0596 | =E8 | ||||
| Income Statement ($ million) | ||||||||
| Sales | 62498 | 78673 | 95023 | =E11*(1+F4) | ||||
| Cost of Goods Sold | 40121 | 52578 | 63186 | =$F$11*H12 | =AVERAGE(C12/$C$11,D12/$D$11,E12/$E$11) | |||
| SG&A Expenses | 5578 | 7135 | 8241 | =$F$11*H13 | =AVERAGE(C13/$C$11,D13/$D$11,E13/$E$11) | |||
| Depreciation Expenses | 3268 | 4298 | 6106 | =$F$11*H14 | =AVERAGE(C14/$C$11,D14/$D$11,E14/$E$11) | |||
| EBIT | =C11-C12-C13-C14 | =D11-D12-D13-D14 | =E11-E12-E13-E14 | =F11-F12-F13-F14 | ||||
| Interest Expense | 3455 | 4567 | 6724 | =E44*F7+E47*F8 | ||||
| Pretax Income | =C15-C17 | =D15-D17 | =E15-E17 | =F15-F17 | ||||
| Taxes | 4663 | 5038 | 5092 | =F18*F5 | ||||
| Net Income | =C18-C20 | =D18-D20 | =E18-E20 | =F18-F20 | ||||
| Allocation of net income | ||||||||
| Dividends | 2124 | 2482 | 2921 | =F21*F6 | ||||
| Addition to retained earnings | =C21-C24 | =D21-D24 | =E21-E24 | =F21-F24 | ||||
| Balance Sheet ($ Million) | ||||||||
| Assets | ||||||||
| Current Assets | ||||||||
| Cash and marketable securities | 2861 | 5275 | 6105 | 7916 | =$F$11*H30 | =AVERAGE(C30/$C$11,D30/$D$11,E30/$E$11) | ||
| Accounts receivable | 13789 | 14341 | 17276 | 22854 | =$F$11*H31 | =AVERAGE(C31/$C$11,D31/$D$11,E31/$E$11) | ||
| Inventory | 17909 | 22402 | 24623 | 30991 | =$F$11*H32 | =AVERAGE(C32/$C$11,D32/$D$11,E32/$E$11) | ||
| Total current assets | =SUM(B30:B32) | =SUM(C30:C32) | =SUM(D30:D32) | =SUM(E30:E32) | =SUM(F30:F32) | |||
| Gross PPE | 222199 | 284026 | 337593 | 410898 | =$F$11*H35 | =AVERAGE(C35/$C$11,D35/$D$11,E35/$E$11) | ||
| Accumulated Depreciation | 66142 | 69410 | 73708 | 79814 | =E36+F14 | |||
| Net PPE | =B35-B36 | =C35-C36 | =D35-D36 | =E35-E36 | =F35-F36 | |||
| Total Assets | =B33+B37 | =C33+C37 | =D33+D37 | =E33+E37 | =F33+F37 | |||
| Liabilities and equity | ||||||||
| Current Liabilities | ||||||||
| Accounts Payable | 21326 | 48500 | 56173 | 63250 | =$F$11*H43 | =AVERAGE(C43/$C$11,D43/$D$11,E43/$E$11) | ||
| Short term debt | 20676 | 28830 | 40450 | 53258 | =F11*H44 | =AVERAGE(C44/$C$11,D44/$D$11,E44/$E$11) | ||
| Total current liabilities | =SUM(B43:B44) | =SUM(C43:C44) | =SUM(D43:D44) | =SUM(E43:E44) | =SUM(F43:F44) | |||
| Long term debt | 26800 | 30910 | 35240 | 48930 | =F39-F53-F45 | |||
| Total liabilities | =B45+B47 | =C45+C47 | =D45+D47 | =E45+E47 | =F45+F47 | |||
| Shareholder's Equity | ||||||||
| Paid in capital | 60300 | 87100 | 107200 | 147400 | =E51 | |||
| Retained Earnings | 61513 | 64802 | 67426 | 70178 | =E52+F25 | |||
| Total Shareholders' Equity | =SUM(B51:B52) | =SUM(C51:C52) | =SUM(D51:D52) | =SUM(E51:E52) | =SUM(F51:F52) | |||
| Total Liabilities and shareholders' Equity | =B48+B53 | =C48+C53 | =D48+D53 | =E48+E53 | =F48+F53 | |||
Add Answer to:
Part A: Create pro forma financial
statements.
This spreadsheet is set up so that green cells...
Develop pro forma financial statements for 2020 on the form provided. Compute interest as if the...
Develop pro forma financial statements for 2020 on the form provided. Compute interest as if the Bank Loan and the LT Debt were reduced on January 1, 2020, so interest is based on your new year-end loan amounts for the entire year. (8 points) Will the Bank Loan increase or decrease by the end of 2020? What changes contribute to the change in the bank loan; that is, what were the primary uses and sources of cash that caused the...
The Loftis Company is preparing its pro forma financial statements for the next year using this...
The Loftis Company is preparing its pro forma financial statements for the next year using this model. The abbreviated financial statements are presented below: Sales Growth 20% Tax Rate 34% Income Statement Sales $780,000 Costs 415,000 Depreciation 135,000 Interest 68,000 Taxable Income $162,000 Taxes 55,080 Net Income $106,920 Dividends 30,000 Additional Retained Earnings $76,920 Balance Sheet Assets Liabilities and Owner's Equity Current Assets $240,000 Total Debt $880,000 Net Fixed $1,350,000 Owners Equity $710,000 $1,590,000 $1,590,000 Required: A. Calculate the Parameter...
Pro forma Income Statement & Balance Sheet for Radial Inc. This exper...
Pro forma Income Statement & Balance Sheet for Radial Inc. This experiential exercise involves creating a pro forma Balance Sheet and a pro forma Income Statement for Radial Inc. Assume the current year is 2015. To assist you in this endeavor, an Excel worksheet containing Radial's 2014 Income Statement and Balance Sheet has been provided. Develop the two pro forma financial statements for 2015 based upon the following assumptions: The company plans to increase sales by an additional 2 percent...
This exercise involves creating a pro forma Balance Sheet and a pro forma Income Statement for...
This exercise involves creating a pro forma Balance Sheet and a pro forma Income Statement for JetBlue Inc. To assist you in this endeavor, a worksheet containing JetBlue’s 2011 Income Statement and Balance Sheet has been provided. Develop the two pro forma financial statements for 2012 based upon the following assumptions. The company plans to increase sales by an additional 10 percent in 2012 due to minor price increases. In addition,the firm plans to launch a massive marketing campaign in...
TABLE 3.3 Pro Forma Financial Statements for R&E Supplies, Inc., December 31, 2018 ($ thousands) Income...
TABLE 3.3 Pro Forma Financial Statements for R&E Supplies, Inc., December 31, 2018 ($ thousands) Income Statement 2018 Comments Net sales $25,766 25% increase Cost of goods sold 22,159 86% of sales Gross profit 3,607 Expenses: General, selling, and administrative expenses 3,092 12% of sales Net interest expense 90 Initially constant Earnings before tax 425 Tax 191 45% tax rate Earnings after tax $ 234 Balance Sheet Assets Current assets: Cash and securities $ 1,271 18 days sales Accounts receivable 3,600 51-day...
Using the following income statement and balance sheet, create a pro-forma income statement and balance sheet....
 Using the following income statement and balance sheet, create a pro-forma income statement and balance sheet. Assume a growth rate of 30%, and that the tax rate and dividend payout remain constant. Costs, assets, and accounts payable vary with sales, but the others do not, and the company is operating at 100% capacity. Use this information to answer the first 5 questions: HOFFMAN COMPANY Income Statement Sales 52,000.00 Costs 41,080.00 Taxable Income 10,920.00 Taxes (32%) 3,494.00 Net Income 7,426.00 Dividends...
S04-01 Pro Forma Statements [LO1] Consider the following simplified financial statements for the Wims Corporation (assuming...
 S04-01 Pro Forma Statements [LO1] Consider the following simplified financial statements for the Wims Corporation (assuming no income taxes) Income Statement Sales $38,000 Balance Sheet Assets $27,300 Debt 6,700 Equity 20,600 Costs 32,600 Net income 5,400 Total $27,300 Total $27,300 The company has predicted a sales increase of 15 percent. It has predicted that every item on the balance sheet will increase by 15 percent as well Create the pro forma statements and reconcile them. (Input all amounts as positive...
Create two years (2020 and 2021) of pro forma income statements and balance sheets and the...
Create two years (2020 and 2021) of pro forma income statements and balance sheets and the statement of cash flows, including operating, investing, and financing sections for 2020 only. Additional Information: The relationship between cost of goods sold and sales revenue Is expected to continue in the near term and no inflation is expected. Operating expenses include $200,000 in depreciation (fixed expense), the remainder is variable costs tied to sales revenue. Fixed assets are adequate to support sales growth for...
Assumptions Balance Sheet Sales increase Tax rate 20.00% 35.00% Assets Current assets Cash 24,280.00 $37,070.00 83,400.00...
 Assumptions Balance Sheet Sales increase Tax rate 20.00% 35.00% Assets Current assets Cash 24,280.00 $37,070.00 83,400.00 $ 144,750.00 Income Statement Accounts receivable 2015 891,600.00 693,600.00 18,240.00 179,760.00 13,400.00 166,360.00 58,226.00 108,134.00 Inventory Total Sales Costs Other expenses EBIT Interest expense Taxable income Taxes (35%) Net income Fixed assets Net plant and equipment $ 396,500.00 Total assets $541,250.00 Liabilities and owners' equity Current liabilities Dividends Add. to retained earnings 35,684.00 72,450.00 Accounts payable $ 65,200.00 $ 16,320.00 $81,520.00 Notes payable Total...
S04-02 Pro Forma Statements and EFN (LO1, 2] Consider the following simplified financial statements for the...
 S04-02 Pro Forma Statements and EFN (LO1, 2] Consider the following simplified financial statements for the Wims Corporation (assuming no income taxes) Income Statement Balance Sheet Sales Costs $38,000 Assets $27,300 Debt $6,700 Equity 20,600 32,600 Net income 5,400 Total $27,300 Total $27,300 The company has predicted a sales increase of 15 percent. Assume Wims pays out half of net income in the form of a cash dividend. Costs and assets vary with sales, but debt and equity do not....
 Using the following income statement and balance sheet, create a pro-forma income statement and balance sheet. Assume a growth rate of 30%, and that the tax rate and dividend payout remain constant. Costs, assets, and accounts payable vary with sales, but the others do not, and the company is operating at 100% capacity. Use this information to answer the first 5 questions: HOFFMAN COMPANY Income Statement Sales 52,000.00 Costs 41,080.00 Taxable Income 10,920.00 Taxes (32%) 3,494.00 Net Income 7,426.00 Dividends...
 S04-01 Pro Forma Statements [LO1] Consider the following simplified financial statements for the Wims Corporation (assuming no income taxes) Income Statement Sales $38,000 Balance Sheet Assets $27,300 Debt 6,700 Equity 20,600 Costs 32,600 Net income 5,400 Total $27,300 Total $27,300 The company has predicted a sales increase of 15 percent. It has predicted that every item on the balance sheet will increase by 15 percent as well Create the pro forma statements and reconcile them. (Input all amounts as positive...
 Assumptions Balance Sheet Sales increase Tax rate 20.00% 35.00% Assets Current assets Cash 24,280.00 $37,070.00 83,400.00 $ 144,750.00 Income Statement Accounts receivable 2015 891,600.00 693,600.00 18,240.00 179,760.00 13,400.00 166,360.00 58,226.00 108,134.00 Inventory Total Sales Costs Other expenses EBIT Interest expense Taxable income Taxes (35%) Net income Fixed assets Net plant and equipment $ 396,500.00 Total assets $541,250.00 Liabilities and owners' equity Current liabilities Dividends Add. to retained earnings 35,684.00 72,450.00 Accounts payable $ 65,200.00 $ 16,320.00 $81,520.00 Notes payable Total...
 S04-02 Pro Forma Statements and EFN (LO1, 2] Consider the following simplified financial statements for the Wims Corporation (assuming no income taxes) Income Statement Balance Sheet Sales Costs $38,000 Assets $27,300 Debt $6,700 Equity 20,600 32,600 Net income 5,400 Total $27,300 Total $27,300 The company has predicted a sales increase of 15 percent. Assume Wims pays out half of net income in the form of a cash dividend. Costs and assets vary with sales, but debt and equity do not....
Most questions answered within 3 hours.
-
An entomologist discovers a dung beetle rolling a ball of dung
along the ground, and decides...
asked 23 minutes ago -
Humans have used horses for transportation for millions of
years. Therefore, they will use horses for...
asked 2 hours ago -
The following are the Jensen Corporation's unit costs of making
and selling an item at a...
asked 2 hours ago -
Does direct Medicare reimbursement of Advanced practice nurses
increase access to their services?
asked 3 hours ago -
List and explain why a company would choose to use a
published
compensation survey vs. creating...
asked 3 hours ago -
A discrete random variable X can take values from 1 to 10. Find
the variance of...
asked 4 hours ago -
The primary financial goal of a corporation is to maximize:
shareholders wealth.
earnings per share.
stock...
asked 4 hours ago -
determine whether the vectors u=(1,2,3,), v=(-2,1,0) and
w=(1,0,1) are linearly dependent or independent.
asked 4 hours ago -
python
Define a function called print_values which takes a dictionary
object as a parameter. The function...
asked 5 hours ago -
In Chapter 1 you created a program named Triangle in
which you displayed a seven-line triangle...
asked 5 hours ago -
Research question: What are the differences between separately
stated and non separately stated transactions in an...
asked 5 hours ago -
By using Arduino write a code that connects two LEDs to two
push-buttons. Each button controls...
asked 6 hours ago