Question 4 Assume that after years of economic recovery, the US economy has reached its natural...
Question 4
- Assume that after years of economic recovery, the US economy has reached its natural rate of output. Explain with a diagram how a continuous rise in oil prices affects the price and output levels of the US.
- Based on your answer in (a), what kind of fiscal policy can be implemented to restore the output level back to its natural rate? Illustrate your answer with a diagram. What will happen to the price and output levels?
- How does the crowding out effect reduce the increase in aggregate demand caused by an expansionary fiscal policy? Explain with a diagram.
Question 5
- How does each of the following events affect Japan's net capital outflow?
- Economic rebound pushes up Japan's interest rate.
(ii) JVC, a Japanese electronics company, sets up a factory in mainland China.
- Suppose the Japanese government runs a budget deficit to boom its economy. Discuss in detail how it affects the real interest rate, net capital outflow, real exchange rate, and the trade balance of Japan. Illustrate your answer with diagrams.
Homework Answers
Solution 4 A
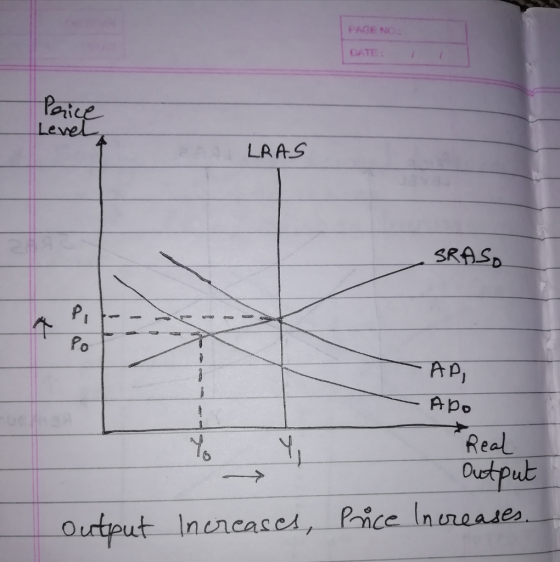
Continous risr in oil prices causes the rates of petrol and diesel to increase and hence transport costs increases substantially. This decreases firms productivity levels to great extent as measure to save costs. This will lead to situations of hyperinflation as well as growth in real GDP.
Solution 4 B
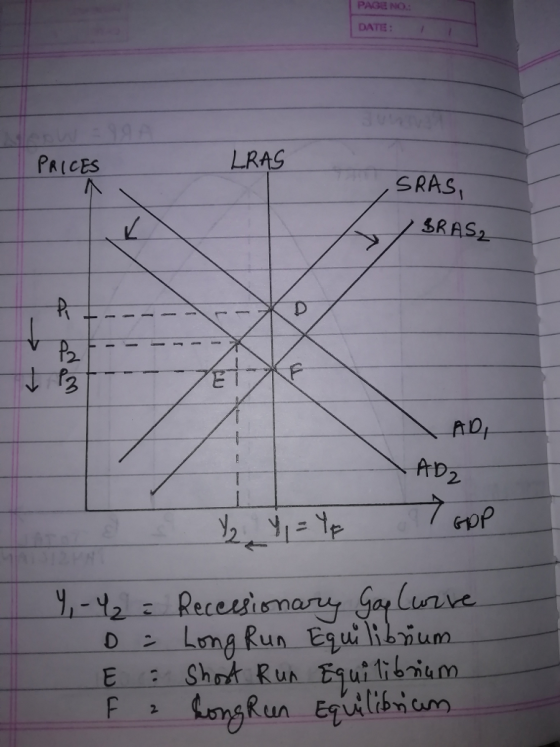
To curb situations of hyperinflation the government shall adopt contractionary fiscal policy by reducing government expenditure and increasing taxation. This reduces the prices in market because aggregate demand falls. As results the real GDP falls to its natural output rate.
Solution 4C
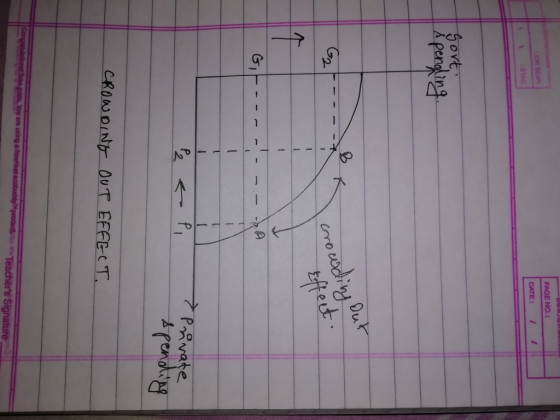
Many times when government adopts expansionary fiscal policy to boost economic prosperity which then leads to increase in interest rates. This dampens investment spending and deters the expected growth in aggregate demand which leads to what we call as Croeding out effect.

Question 5 A
If Japans interest rate rise it causes investors to invest more money into Japan and hence net capital outflow decreases while net capital inflow increases.
JVC if sets up factory in China the revenue and expenditure flows in that country and hence net capital outflow increases.
Solution 5B
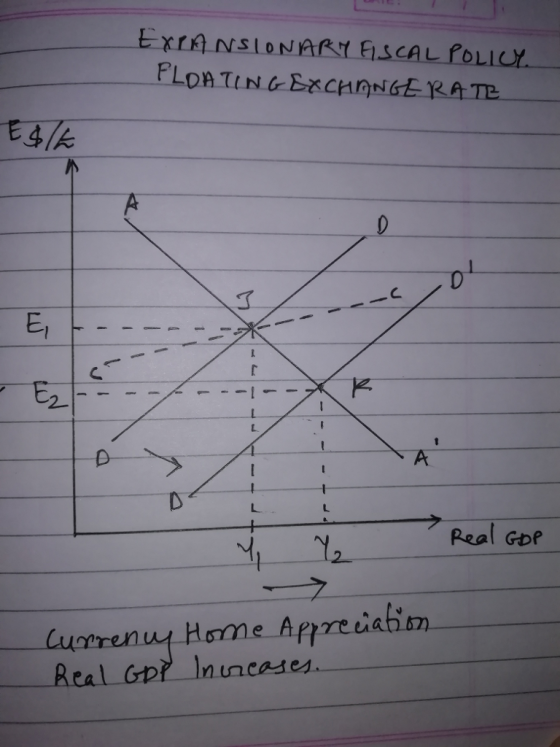
Expansionary fiscal policy causes government to borroe more money from foreign or larger banks and hence money demand increases causing interest rates to rise. This causes fomestic currency to appreciated and real exchange rate thus appreciates real exchange rate. Also investors tend to invest more where interest rate is higber causing rise in FII and hence Net capital outflow decreases and net capital inflow increases . Now since currency appreciates it causes rise in imports and decrease in exports and hence trade deficit widens.
Add Answer to:
Question 4
Assume that after years of economic recovery, the US economy
has reached its natural...
If the economy is at the natural rate of unemployment with the level of real GDP...
If the economy is at the natural rate of unemployment with the level of real GDP at potential output, what would expansionary fiscal or monetary policy do to the economy? How would the economy be effected in the short run and long run? Does the Phillips Curve theory explain what happens?
Pls do not handwrite the answer, this is for easy reading Question 4 a)Country Alpha has...
Pls do not handwrite the answer, this is for easy reading Question 4 a)Country Alpha has a fixed exchange rate system and free capital mobility. Due to an economic recession and a trade deficit, it is pursuing an expansionary fiscal policy to improve the country’s balance of payments. Illustrate and discuss if this expansionary fiscal policy is effective to achieve the country’s economic growth and balance of payments. b)Country Sigma is an open economy with a flexible exchange rate and...
In 2019, the United States is experiencing an unemployment rate that is below its natural rate...
In 2019, the United States is experiencing an unemployment rate that is below its natural rate of unemployment. That is, its labor force is more than fully employed. However, the country is suffering from a rising fiscal deficit, a rising government debt/GDP ratio, and an expanding current account deficit. In addition, after years of quantitative easing in the wake of the 2008-09 financial crisis and economic recession, the Federal Reserve must now roll back its quantitative easing and shrink its...
Question Two: Assume the following equations summarize the structure of an economy. С = Ca +...
 Question Two: Assume the following equations summarize the structure of an economy. С = Ca + 0.7(Y - T) Са = 2,000 - 50 T = 150 + 0.15Y (M/P)! = 0.34 - 10r MS/P 3,000 2,000 -10r G = 4,000 - .2y NX = 1,500 - 0.1 Y-5r i = A. Calculate the equilibrium real output (Y) and (r). B. If government spending increases by 100, compute by how much the fed must increase the money supply if it...
An economy is operating with an output that is $600 billion dollars above its natural rate...
An economy is operating with an output that is $600 billion dollars above its natural rate of $2400 billion dollars and fiscal policymakers want to close the inflationary gap. The central bank agrees to hold the interest rate constant so there is no crowding out. The marginal propensity to consume is 3/4. In which direction and by how much would the government spending need to change to close the gap? Fully explain your answer and provide a graph that shows...
ca Question Two: Assume the following equations summarize the structure of an economy. с = C2...
 ca Question Two: Assume the following equations summarize the structure of an economy. с = C2 +0.7(Y-T) = 2,000 - 50 T = 150+ 0.15Y (M/P) = 0.3Y - 10r M/P = 3,000 = 2,000 -10r G 4,000 - 2y NX = 1,500 -0.1 Y-5r i A. Calculate the equilibrium real output (Y) and (r). B. If government spending increases by 100, compute by how much the fed must increase the money supply if it wants to avoid the crowding...
Question Two: Assume the following equations summarize the structure of an economy. с =C+0.7(Y - T)...
 Question Two: Assume the following equations summarize the structure of an economy. с =C+0.7(Y - T) Са = 2,000 - 5r T 150+ 0.15Y (M/P) = 0.3Y - 10r M/P 3,000 2,000 -10r G 4,000 - 2y NX 1,500 -0.1 Y-5r A. Calculate the equilibrium real output (Y) and (r). B. If government spending increases by 100, compute by how much the fed must increase the money supply if it wants to avoid the crowding out of expansionary fiscal policy....
Question Two: Assume the following equations summarize the structure of an economy. С C+0.7(Y-T) са 2,000...
 Question Two: Assume the following equations summarize the structure of an economy. С C+0.7(Y-T) са 2,000 - 5r T 150 +0.157 (M/P)+ - 0.3Y - 10r MS/P 3,000 2,000 -10r G 4,000 - 2y NX - 1,500 -0.1 Y-5r A. Calculate the equilibrium real output (Y) and (r). B. If government spending increases by 100, compute by how much the fed must increase the money supply if it wants to avoid the crowding out of expansionary fiscal policy. Make sure...
1. Suppose in a simple closed economy with MPC = 0.75, the planned investment spending nas...
 1. Suppose in a simple closed economy with MPC = 0.75, the planned investment spending nas suddenly fallen, reducing AD and output to a level that below the natural level of output by 100 Million. Assume that the real interest rate is constant so that there is no crowding out of (gross) investment. (a) If the government decided to try to get the output back to the natural level of output using only a change in government spending (AG), by...
1. Is the Phillips curve a myth? Intertemporal tradeoff between inflation and unemployment After the World...
 1. Is the Phillips curve a myth? Intertemporal tradeoff between inflation and unemployment After the World War II, empirical economists noticed that, in many advanced economies, as unemployment fell, inflation tended to rise, and vice versa. The inverse relationship between unemployment and Inflation, was depicted as the Phillips curve, after William Phillips of the London School of Economics. In the 1950s and 1960s, the Phillips curve convinced many policy makers that they could use the relationship to pick acceptable levels...
 Question Two: Assume the following equations summarize the structure of an economy. С = Ca + 0.7(Y - T) Са = 2,000 - 50 T = 150 + 0.15Y (M/P)! = 0.34 - 10r MS/P 3,000 2,000 -10r G = 4,000 - .2y NX = 1,500 - 0.1 Y-5r i = A. Calculate the equilibrium real output (Y) and (r). B. If government spending increases by 100, compute by how much the fed must increase the money supply if it...
 ca Question Two: Assume the following equations summarize the structure of an economy. с = C2 +0.7(Y-T) = 2,000 - 50 T = 150+ 0.15Y (M/P) = 0.3Y - 10r M/P = 3,000 = 2,000 -10r G 4,000 - 2y NX = 1,500 -0.1 Y-5r i A. Calculate the equilibrium real output (Y) and (r). B. If government spending increases by 100, compute by how much the fed must increase the money supply if it wants to avoid the crowding...
 Question Two: Assume the following equations summarize the structure of an economy. с =C+0.7(Y - T) Са = 2,000 - 5r T 150+ 0.15Y (M/P) = 0.3Y - 10r M/P 3,000 2,000 -10r G 4,000 - 2y NX 1,500 -0.1 Y-5r A. Calculate the equilibrium real output (Y) and (r). B. If government spending increases by 100, compute by how much the fed must increase the money supply if it wants to avoid the crowding out of expansionary fiscal policy....
 Question Two: Assume the following equations summarize the structure of an economy. С C+0.7(Y-T) са 2,000 - 5r T 150 +0.157 (M/P)+ - 0.3Y - 10r MS/P 3,000 2,000 -10r G 4,000 - 2y NX - 1,500 -0.1 Y-5r A. Calculate the equilibrium real output (Y) and (r). B. If government spending increases by 100, compute by how much the fed must increase the money supply if it wants to avoid the crowding out of expansionary fiscal policy. Make sure...
 1. Suppose in a simple closed economy with MPC = 0.75, the planned investment spending nas suddenly fallen, reducing AD and output to a level that below the natural level of output by 100 Million. Assume that the real interest rate is constant so that there is no crowding out of (gross) investment. (a) If the government decided to try to get the output back to the natural level of output using only a change in government spending (AG), by...
 1. Is the Phillips curve a myth? Intertemporal tradeoff between inflation and unemployment After the World War II, empirical economists noticed that, in many advanced economies, as unemployment fell, inflation tended to rise, and vice versa. The inverse relationship between unemployment and Inflation, was depicted as the Phillips curve, after William Phillips of the London School of Economics. In the 1950s and 1960s, the Phillips curve convinced many policy makers that they could use the relationship to pick acceptable levels...
Most questions answered within 3 hours.
-
there is a function to create two random numbers between 1 and
25 and a function...
asked 11 minutes ago -
At a certain temperature, the ?pKp for the decomposition of
H2SH2S is 0.832.0.832.
H2S(g)↽−−⇀H2(g)+S(g)H2S(g)↽−−⇀H2(g)+S(g)
Initially, only...
asked 5 minutes ago -
Part 1.C&A Fast Food has four activities in serving a
customer: greet customer, take order, process...
asked 11 minutes ago -
Which attribute allows you to specify a custom "thumbnail" for
multimedia elements?
asked 50 minutes ago -
How much 0.1200 M sodium hydroxide solution is need to titrate
14 mL of a 0.100...
asked 25 minutes ago -
An impulse is a change in momentum usually over
a short time. For which of the...
asked 30 minutes ago -
1a)When a 5000-kg roller coaster train full of riders approaches
the loading dock at a speed...
asked 50 minutes ago -
The Poseidon Swim Company produces swim trunks. The average
selling price for one of their swim...
asked 45 minutes ago -
If the elasticity of supply of a good is ∞, then its
A. supply curve is...
asked 31 minutes ago -
Write an application for the Shady Rest Hotel; the program
determines the price of a room....
asked 36 minutes ago -
USE THE FOLLOWING INFORMATION TO ANSWER THE NEXT (6)
QUESTIONS:
The following is a December 31,...
asked 52 minutes ago -
Suppose you plan to invest $5,000 each year (beginning at the
end of this year) into...
asked 42 minutes ago