1. Prepare a vertical analysis for Ambrose for both its income statement and balance sheet. 2....
|
1. |
Prepare a vertical analysis for Ambrose for both its income statement and balance sheet. |
|
2. |
Compare the company's profit performance and financial position with the average for the industry. |
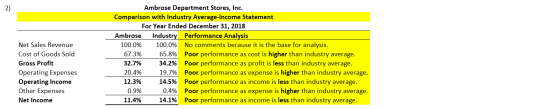
Ambrose Department Stores, Inc.
Income Statement Compared with Industry Average
Year Ended December 31, 2018
Industry
Ambrose Average
Net Sales Revenue $780,000 100.0 %
Cost of Goods Sold 524,940 65.8
Gross Profit 255,060 34.2
Operating Expenses 159,120 19.7
Operating Income 95,940 14.5
Other Expenses 7,020 0.4
Net Income $88,920 14.1 %
Ambrose Department Stores, Inc.
Balance Sheet Compared with Industry Average
December 31, 2018
Industy
Ambrose
Average
Current Assets
$325,920
70.9 %
Property, Plant, and Equipment, Net
121,920
23.6
Intangible Assets, Net
9,600
0.8
Other Assets
22,560
4.7
Total Assets $480,000 100.0 %
Current Liabilities $219,840
48.1 %
Long-term Liabilities 110,400
16.6
Total Liabilities 330,240
64.7
Stockholders' Equity 149,760
35.3
Total Liabilities and Stockholders' Equity $480,000 100.0 %
Homework Answers


Add Answer to:
1.
Prepare a vertical analysis for Ambrose for both its income
statement and balance sheet.
2....
he Ambrose Department Stores, Inc. chief executive officer (CEO) has asked you to compare the company's...
 he Ambrose Department Stores, Inc. chief executive officer (CEO) has asked you to compare the company's profit performance and fi he company's income statement and balance sheet as well as the industry average data for retailers. Click the icon to view the income statement 囲(Click the icon to view the balance sheet. Read the requirements. Ambrose Department Stores, Inc Common-Size Income Statement Year Ended December 31, 2018 Ambrose Industry Average 100.01% 100.0 % 65.8 34.2 % 19.7 14.5 % 0.4...
can i get help please? you the The Rim Department Stores, Inc. chief executive officer (CEO)...
 can i get help please?
you the The Rim Department Stores, Inc. chief executive officer (CEO) has asked you to compare the company's profit performance and financial position with the average for the industry. The CEO company's income statement and balance sheet as well as the industry average data for retailers. Click the icon to view the income statement.) Click the icon to view the balance shoot.) Read the row rements Begin by preparing a vertical analysis for Rim for...
can i get help please?
you the The Rim Department Stores, Inc. chief executive officer (CEO) has asked you to compare the company's profit performance and financial position with the average for the industry. The CEO company's income statement and balance sheet as well as the industry average data for retailers. Click the icon to view the income statement.) Click the icon to view the balance shoot.) Read the row rements Begin by preparing a vertical analysis for Rim for...
Data Table Specialty Department Stores, Inc. Income Statement Compared with Industry Average Year Ended December 31,...
 Data Table Specialty Department Stores, Inc. Income Statement Compared with Industry Average Year Ended December 31, 2018 Industry Specialty Average Net Sales Revenue 777,000 100.0 % 522,144 Cost of Goods Sold 65.8 Gross Profit 254,856 34.2. Operating Expenses 163,170 19.7 Operating Income 91,686 14.5 3,885 Other Expenses 0.4 $ 87,801 14.1 % Net Income i Data Table Specialty Department Stores, Inc. Balance Sheet Compared with Industry Average December 31, 2018 Industry Specialty Average $ Current Assets Property, Plant, and Equipment,...
can i get help please? The Verifine Department Stores, Inc. chief executive officer (CEO) has asked...
 can i get help please?
The Verifine Department Stores, Inc. chief executive officer (CEO) has asked you to compare the company's profit performance and financial position with the average for the industry. The company's income statement and balance sheet as well as the industry average data for retailers. (Click the icon to view the income statement.) (Click the icon to view the balance sheet.) Read the requirements Verifine Department Stores, Inc. Income Statement Year Ended December 31, 2018 Amount Percent...
can i get help please?
The Verifine Department Stores, Inc. chief executive officer (CEO) has asked you to compare the company's profit performance and financial position with the average for the industry. The company's income statement and balance sheet as well as the industry average data for retailers. (Click the icon to view the income statement.) (Click the icon to view the balance sheet.) Read the requirements Verifine Department Stores, Inc. Income Statement Year Ended December 31, 2018 Amount Percent...
can i please get help? c h e The Voine Department stores, Incchief executive officer (CEO)...
 can i please get help?
c h e The Voine Department stores, Incchief executive officer (CEO) has asked you to compare the company profit performance and financial position with the average for the company's income statement and balance sheet as well as the industry average data for retailers 11. Click the con lo view the income statement.) Click the icon to view the balance sheet Read the requirements Begin by preparing a vertical analysis for Verifine for its income statement...
can i please get help?
c h e The Voine Department stores, Incchief executive officer (CEO) has asked you to compare the company profit performance and financial position with the average for the company's income statement and balance sheet as well as the industry average data for retailers 11. Click the con lo view the income statement.) Click the icon to view the balance sheet Read the requirements Begin by preparing a vertical analysis for Verifine for its income statement...
CA O The Verrine Department Stores, Inc. chief executive officer (CEO) has asked you to compare...
 CA O The Verrine Department Stores, Inc. chief executive officer (CEO) has asked you to compare the company's profit performance and financial position with the verge for the industry the LOR Companys come statement and w e shoes well as the industry average data for retailers Click the icon to view the come statement Cick the icon to the balance sheet.) Read the current Begin by preparing a vertical analysis for Verfforts income statement (Hound percent of total amounts on...
e average for the industry. The CEO has given your company's The Rim Department Stores, Inc....
 e average for the industry. The CEO has given your company's The Rim Department Stores, Inc. chief executive cfficer (CEO) has asked you to compare the company's profit performance and transportow nne income statement and balance sheet well as the industry average data for retailers Click the icon to view the income statement) Click the icon to view the balance sheet) en Requirements. Prepare a common income atement and balance sheet form. The first column of each statement should present...
Show step by step working claculations Income Statement compared with Industry Average For the year ended 30th June 201...
 Show step by step working claculations
Income Statement compared with Industry Average For the year ended 30th June 2016 Peters Industry Average 100.0% Net sales $972,500 Cost of sales 653.520 65.8 34.2 Gross profit Selling and general expenses Other expenses Profit 318,980 201,308 5.835 19.7 04 Peters Retailers Pty Statement of financial Position compared with Industry Average as at 30h June 2016 Peters Industry Average $406,800 70.9% 151,200 23.6 0.8 Current assets Property, plant and equipment, net Intangible assets, net...
Show step by step working claculations
Income Statement compared with Industry Average For the year ended 30th June 2016 Peters Industry Average 100.0% Net sales $972,500 Cost of sales 653.520 65.8 34.2 Gross profit Selling and general expenses Other expenses Profit 318,980 201,308 5.835 19.7 04 Peters Retailers Pty Statement of financial Position compared with Industry Average as at 30h June 2016 Peters Industry Average $406,800 70.9% 151,200 23.6 0.8 Current assets Property, plant and equipment, net Intangible assets, net...
a 1 c66 10 1 Ba964c469d18dab?deeplink true8 platforms idad&idpName: SMS &conte tld-urn%3Audson%3ApeE End Of Chapter: Financial...
 a 1 c66 10 1 Ba964c469d18dab?deeplink true8 platforms idad&idpName: SMS &conte tld-urn%3Audson%3ApeE End Of Chapter: Financial Statement Analysis sheet, as well as the industry average data for retailers. Block Department Stores, Inc. 2 ncome Statement ared with For the Year December 31 lock Industry Average 6 Sales revenues 7 Less: Cost of goods sold 526,286 255,714 164,220 657% 195% 0.5% 0.396 9 Less: Operat 10 Operating income 11 Less: Interest expense es 173 12 Income before income taxes 13 Less:...
Requirement 1. Prepare a vertical analysis for McConnell for both its income statement and balance sheet....
 Requirement 1. Prepare a vertical analysis for McConnell for both its income statement and balance sheet. Begin by preparing a vertical analysis for McConnell for its income statement. (Round the percent of total amounts to one decimal place, X.X%.) McConnell Department Stores, Inc. Income Statement Year Ended December 31, 2018 Amount Percent of Total Net Sales Revenue $ % 783,000 526,176 Cost of Goods Sold % Gross Profit % 256,824 163,647 % Operating Expenses Operating Income % 93,177 4,698 Other...
 he Ambrose Department Stores, Inc. chief executive officer (CEO) has asked you to compare the company's profit performance and fi he company's income statement and balance sheet as well as the industry average data for retailers. Click the icon to view the income statement 囲(Click the icon to view the balance sheet. Read the requirements. Ambrose Department Stores, Inc Common-Size Income Statement Year Ended December 31, 2018 Ambrose Industry Average 100.01% 100.0 % 65.8 34.2 % 19.7 14.5 % 0.4...
 can i get help please?
you the The Rim Department Stores, Inc. chief executive officer (CEO) has asked you to compare the company's profit performance and financial position with the average for the industry. The CEO company's income statement and balance sheet as well as the industry average data for retailers. Click the icon to view the income statement.) Click the icon to view the balance shoot.) Read the row rements Begin by preparing a vertical analysis for Rim for...
can i get help please?
you the The Rim Department Stores, Inc. chief executive officer (CEO) has asked you to compare the company's profit performance and financial position with the average for the industry. The CEO company's income statement and balance sheet as well as the industry average data for retailers. Click the icon to view the income statement.) Click the icon to view the balance shoot.) Read the row rements Begin by preparing a vertical analysis for Rim for...
 Data Table Specialty Department Stores, Inc. Income Statement Compared with Industry Average Year Ended December 31, 2018 Industry Specialty Average Net Sales Revenue 777,000 100.0 % 522,144 Cost of Goods Sold 65.8 Gross Profit 254,856 34.2. Operating Expenses 163,170 19.7 Operating Income 91,686 14.5 3,885 Other Expenses 0.4 $ 87,801 14.1 % Net Income i Data Table Specialty Department Stores, Inc. Balance Sheet Compared with Industry Average December 31, 2018 Industry Specialty Average $ Current Assets Property, Plant, and Equipment,...
 can i get help please?
The Verifine Department Stores, Inc. chief executive officer (CEO) has asked you to compare the company's profit performance and financial position with the average for the industry. The company's income statement and balance sheet as well as the industry average data for retailers. (Click the icon to view the income statement.) (Click the icon to view the balance sheet.) Read the requirements Verifine Department Stores, Inc. Income Statement Year Ended December 31, 2018 Amount Percent...
can i get help please?
The Verifine Department Stores, Inc. chief executive officer (CEO) has asked you to compare the company's profit performance and financial position with the average for the industry. The company's income statement and balance sheet as well as the industry average data for retailers. (Click the icon to view the income statement.) (Click the icon to view the balance sheet.) Read the requirements Verifine Department Stores, Inc. Income Statement Year Ended December 31, 2018 Amount Percent...
 can i please get help?
c h e The Voine Department stores, Incchief executive officer (CEO) has asked you to compare the company profit performance and financial position with the average for the company's income statement and balance sheet as well as the industry average data for retailers 11. Click the con lo view the income statement.) Click the icon to view the balance sheet Read the requirements Begin by preparing a vertical analysis for Verifine for its income statement...
can i please get help?
c h e The Voine Department stores, Incchief executive officer (CEO) has asked you to compare the company profit performance and financial position with the average for the company's income statement and balance sheet as well as the industry average data for retailers 11. Click the con lo view the income statement.) Click the icon to view the balance sheet Read the requirements Begin by preparing a vertical analysis for Verifine for its income statement...
 CA O The Verrine Department Stores, Inc. chief executive officer (CEO) has asked you to compare the company's profit performance and financial position with the verge for the industry the LOR Companys come statement and w e shoes well as the industry average data for retailers Click the icon to view the come statement Cick the icon to the balance sheet.) Read the current Begin by preparing a vertical analysis for Verfforts income statement (Hound percent of total amounts on...
 e average for the industry. The CEO has given your company's The Rim Department Stores, Inc. chief executive cfficer (CEO) has asked you to compare the company's profit performance and transportow nne income statement and balance sheet well as the industry average data for retailers Click the icon to view the income statement) Click the icon to view the balance sheet) en Requirements. Prepare a common income atement and balance sheet form. The first column of each statement should present...
 Show step by step working claculations
Income Statement compared with Industry Average For the year ended 30th June 2016 Peters Industry Average 100.0% Net sales $972,500 Cost of sales 653.520 65.8 34.2 Gross profit Selling and general expenses Other expenses Profit 318,980 201,308 5.835 19.7 04 Peters Retailers Pty Statement of financial Position compared with Industry Average as at 30h June 2016 Peters Industry Average $406,800 70.9% 151,200 23.6 0.8 Current assets Property, plant and equipment, net Intangible assets, net...
Show step by step working claculations
Income Statement compared with Industry Average For the year ended 30th June 2016 Peters Industry Average 100.0% Net sales $972,500 Cost of sales 653.520 65.8 34.2 Gross profit Selling and general expenses Other expenses Profit 318,980 201,308 5.835 19.7 04 Peters Retailers Pty Statement of financial Position compared with Industry Average as at 30h June 2016 Peters Industry Average $406,800 70.9% 151,200 23.6 0.8 Current assets Property, plant and equipment, net Intangible assets, net...
 a 1 c66 10 1 Ba964c469d18dab?deeplink true8 platforms idad&idpName: SMS &conte tld-urn%3Audson%3ApeE End Of Chapter: Financial Statement Analysis sheet, as well as the industry average data for retailers. Block Department Stores, Inc. 2 ncome Statement ared with For the Year December 31 lock Industry Average 6 Sales revenues 7 Less: Cost of goods sold 526,286 255,714 164,220 657% 195% 0.5% 0.396 9 Less: Operat 10 Operating income 11 Less: Interest expense es 173 12 Income before income taxes 13 Less:...
 Requirement 1. Prepare a vertical analysis for McConnell for both its income statement and balance sheet. Begin by preparing a vertical analysis for McConnell for its income statement. (Round the percent of total amounts to one decimal place, X.X%.) McConnell Department Stores, Inc. Income Statement Year Ended December 31, 2018 Amount Percent of Total Net Sales Revenue $ % 783,000 526,176 Cost of Goods Sold % Gross Profit % 256,824 163,647 % Operating Expenses Operating Income % 93,177 4,698 Other...
Most questions answered within 3 hours.
-
1. An object weighing 40 N rests on a surface. The coefficient
of friction is 0.35....
asked 13 minutes ago -
Investor company owns 35% of investee company voting stock and
accounts for the investment under the...
asked 1 hour ago -
The number of major faults on a randomly chosen 1 km stretch of
highway has a...
asked 1 hour ago -
Consider the competitive environment of Starbuck's, Progressive
Insurance, a manufacturing firm with low turnover, or a...
asked 2 hours ago -
3. Gains from trade
Consider two neighbouring island countries called Euphoria and
Contente. They each have...
asked 4 hours ago -
A business executive has the option to invest money in two
plans: Plan A guarantees that...
asked 6 hours ago -
Hello, can someone please help me answer this question?
How much heat is absorbed by a...
asked 6 hours ago -
. A marketing researcher conducted a survey of 25 shoppers
randomly selected at the local mall...
asked 6 hours ago -
Create an comprehensive response to the
following:
Antimicrobial agents work on a multitude of microbes (bacteria,...
asked 6 hours ago -
6.13 LAB: Step counter. Section 6.3.
A pedometer treats walking 2,000 steps as walking 1 mile....
asked 6 hours ago -
(14.2) A block of mass m = 10 kg riding on a frictionless
horizontal plane is...
asked 6 hours ago -
Use any search engine to search for articles about Starbucks
partnership with Tata Companies in India...
asked 6 hours ago