1. Perform the indicated goodness-of-fit test. A company manager wishes to test a union leader's claim...
1. Perform the indicated goodness-of-fit
test.
A company manager wishes to test a union leader's claim that
absences occur on the different week days with the same
frequencies. Test this claim at the 0.05 level of significance if
the following sample data have been compiled.

a. test statistic
b. critical value
2.Perform the indicated goodness-of-fit
test.
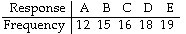
In studying the responses to a multiple-choice test question, the
following sample data were obtained. At the 0.05 significance
level, test the claim that the responses occur with the same
frequency.

a. test statistic
b. critical value
3. Perform the indicated goodness-of-fit
test.
Using the data below and a 0.05 significance level, test the claim
that the responses occur with percentages of 15%, 20%, 25%, 25%,
and 15% respectively.
a. test statistic
b. critical value
Homework Answers
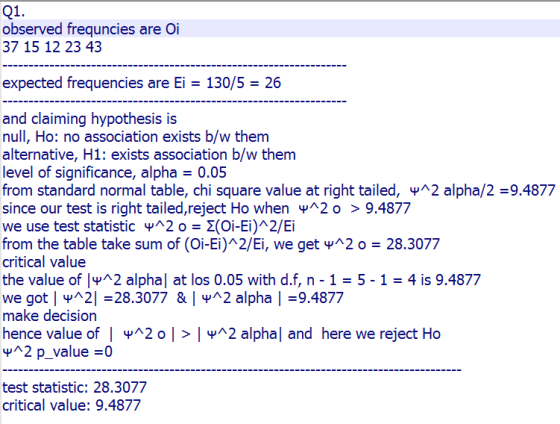
| Observed (Oi ) | Expected ( Ei) | Oi-Ei | (Oi-Ei)^2 | (Oi-Ei)^2/Ei |
| 37 | 26 | 11 | 121 | 4.6538 |
| 15 | 26 | -11 | 121 | 4.6538 |
| 12 | 26 | -14 | 196 | 7.5385 |
| 23 | 26 | -3 | 9 | 0.3462 |
| 43 | 26 | 17 | 289 | 11.1154 |
Add Answer to:
1. Perform the indicated goodness-of-fit
test.
A company manager wishes to test a union leader's claim...
1. Perform the indicated goodness-of-fit test. Using the data below and a 0.05 significance level, test the claim that...
 1. Perform the indicated goodness-of-fit
test.
Using the data below and a 0.05 significance level, test the claim
that the responses occur with percentages of 15%, 20%, 25%, 25%,
and 15% respectively.
a. test statistic
b. critical value
2.Perform the indicated goodness-of-fit
test.
In studying the responses to a multiple-choice test question, the
following sample data were obtained. At the 0.05 significance
level, test the claim that the responses occur with the same
frequency.
a. test statistic
b. critical value
1. Perform the indicated goodness-of-fit
test.
Using the data below and a 0.05 significance level, test the claim
that the responses occur with percentages of 15%, 20%, 25%, 25%,
and 15% respectively.
a. test statistic
b. critical value
2.Perform the indicated goodness-of-fit
test.
In studying the responses to a multiple-choice test question, the
following sample data were obtained. At the 0.05 significance
level, test the claim that the responses occur with the same
frequency.
a. test statistic
b. critical value
Goodness of Fit Test Perform the Goodness-of-Fit Test 1) Perform the indicated goodness-of-fit test. A company...
 Goodness of Fit Test Perform the Goodness-of-Fit Test 1) Perform the indicated goodness-of-fit test. A company manager wishes to test a union leader's claim that absences occur on the different week days with the same frequencies. Test this claim at the 0.05 level of significance if the following sample data have been compiled. Day Mon Tue Wed Thurs Fri Absences 37 15 12 23 43 Step 1: Ho: H Step 2: Significance level is Step 3: Test Statistics Step 4:...
A company manager wishes to test a union leader's claim that absences occur on the different...
 A company manager wishes to test a union leader's claim that absences occur on the different week days with the same frequencies. test this claim at the 0.05 level of significance if the following sample data have been compiled. Use the P-value method of hypothesis testing to answer the following questions. Day Absences Mon 37 Tue 15 Wed 12 Thu 23 Fri 43 1/ Whats Test Statistic? 2/ What's P-value? 3/ Statistical Conclusion?
1. Perform the indicated goodness-of-fit test. Use a significance level of 0.01 to test the claim...
 1. Perform the indicated goodness-of-fit
test.
Use a significance level of 0.01 to test the claim that workplace
accidents are distributed on workdays as follows: Monday 25%,
Tuesday: 15%, Wednesday: 15%, Thursday: 15%, and Friday: 30%.
In a study of 100 workplace accidents, 26 occurred on a Monday, 15
occurred on a Tuesday, 17 occurred on a Wednesday, 17 occurred on a
Thursday, and 25 occurred on a Friday.
a. test statistic.
b. critical value
2. Perform the indicated goodness-of-fit...
1. Perform the indicated goodness-of-fit
test.
Use a significance level of 0.01 to test the claim that workplace
accidents are distributed on workdays as follows: Monday 25%,
Tuesday: 15%, Wednesday: 15%, Thursday: 15%, and Friday: 30%.
In a study of 100 workplace accidents, 26 occurred on a Monday, 15
occurred on a Tuesday, 17 occurred on a Wednesday, 17 occurred on a
Thursday, and 25 occurred on a Friday.
a. test statistic.
b. critical value
2. Perform the indicated goodness-of-fit...
Perform the indicated goodness-of-fit test. Fill in the table below to find the test statistic. 9)...
 Perform the indicated goodness-of-fit test. Fill in the table below to find the test statistic. 9) In studying the responses to a multiple-choice test question, the following sample data were obtained. At the 0.05 significance level, test the claim that the responses occur with the same frequency A. Classical method with Chi-square statistic (0-E) (0-E)^2 [(O-E)^2]/E Response A B C D E Frequency 12 15 16 18 19 RESPONSE o E A 12 В 15 16 C 16 D 18...
Perform the indicated goodness-of-fit test. You roll a die 48 times with the following results. a....
 Perform the indicated goodness-of-fit
test.
You roll a die 48 times with the following results.
a. test statistic
b. critical value
Use a significance level of 0.05 to test the claim that the die is
fair.
Perform the indicated goodness-of-fit
test.
You roll a die 48 times with the following results.
a. test statistic
b. critical value
Use a significance level of 0.05 to test the claim that the die is
fair.
3) Find the test statistics x2 for the indicated goodness-of-fit test. (Do not write out the...
 3) Find the test statistics x2 for the indicated goodness-of-fit test. (Do not write out the entire test) 3) Using the data below and a 0.05 significance level, test the claim that the responses occur with percentages of 15%, 20%, 25%, 25%, and 15% respectively. Response A B C D E Frequency 12 15 16 18 19 Fill out the table below and use it to find the test statistics x2. (0-E2 E 0 E O-E (0-E)2 +2=
3) Find the test statistics x2 for the indicated goodness-of-fit test. (Do not write out the...
 3) Find the test statistics x2 for the indicated goodness-of-fit test. (Do not write out the entire test) 3) Using the data below and a 0.05 significance level, test the claim that the responses occur with percentages of 15%, 20%, 25%, 25%, and 15% respectively. Response A B C D E Frequency 12 15 16 18 19 Fill out the table below and use it to find the test statistics x2. (0-E) E 0 E O-E (0-E) x2 = given...
 1. Perform the indicated goodness-of-fit
test.
Using the data below and a 0.05 significance level, test the claim
that the responses occur with percentages of 15%, 20%, 25%, 25%,
and 15% respectively.
a. test statistic
b. critical value
2.Perform the indicated goodness-of-fit
test.
In studying the responses to a multiple-choice test question, the
following sample data were obtained. At the 0.05 significance
level, test the claim that the responses occur with the same
frequency.
a. test statistic
b. critical value
1. Perform the indicated goodness-of-fit
test.
Using the data below and a 0.05 significance level, test the claim
that the responses occur with percentages of 15%, 20%, 25%, 25%,
and 15% respectively.
a. test statistic
b. critical value
2.Perform the indicated goodness-of-fit
test.
In studying the responses to a multiple-choice test question, the
following sample data were obtained. At the 0.05 significance
level, test the claim that the responses occur with the same
frequency.
a. test statistic
b. critical value
 Goodness of Fit Test Perform the Goodness-of-Fit Test 1) Perform the indicated goodness-of-fit test. A company manager wishes to test a union leader's claim that absences occur on the different week days with the same frequencies. Test this claim at the 0.05 level of significance if the following sample data have been compiled. Day Mon Tue Wed Thurs Fri Absences 37 15 12 23 43 Step 1: Ho: H Step 2: Significance level is Step 3: Test Statistics Step 4:...
 A company manager wishes to test a union leader's claim that absences occur on the different week days with the same frequencies. test this claim at the 0.05 level of significance if the following sample data have been compiled. Use the P-value method of hypothesis testing to answer the following questions. Day Absences Mon 37 Tue 15 Wed 12 Thu 23 Fri 43 1/ Whats Test Statistic? 2/ What's P-value? 3/ Statistical Conclusion?
 1. Perform the indicated goodness-of-fit
test.
Use a significance level of 0.01 to test the claim that workplace
accidents are distributed on workdays as follows: Monday 25%,
Tuesday: 15%, Wednesday: 15%, Thursday: 15%, and Friday: 30%.
In a study of 100 workplace accidents, 26 occurred on a Monday, 15
occurred on a Tuesday, 17 occurred on a Wednesday, 17 occurred on a
Thursday, and 25 occurred on a Friday.
a. test statistic.
b. critical value
2. Perform the indicated goodness-of-fit...
1. Perform the indicated goodness-of-fit
test.
Use a significance level of 0.01 to test the claim that workplace
accidents are distributed on workdays as follows: Monday 25%,
Tuesday: 15%, Wednesday: 15%, Thursday: 15%, and Friday: 30%.
In a study of 100 workplace accidents, 26 occurred on a Monday, 15
occurred on a Tuesday, 17 occurred on a Wednesday, 17 occurred on a
Thursday, and 25 occurred on a Friday.
a. test statistic.
b. critical value
2. Perform the indicated goodness-of-fit...
 Perform the indicated goodness-of-fit test. Fill in the table below to find the test statistic. 9) In studying the responses to a multiple-choice test question, the following sample data were obtained. At the 0.05 significance level, test the claim that the responses occur with the same frequency A. Classical method with Chi-square statistic (0-E) (0-E)^2 [(O-E)^2]/E Response A B C D E Frequency 12 15 16 18 19 RESPONSE o E A 12 В 15 16 C 16 D 18...
 Perform the indicated goodness-of-fit
test.
You roll a die 48 times with the following results.
a. test statistic
b. critical value
Use a significance level of 0.05 to test the claim that the die is
fair.
Perform the indicated goodness-of-fit
test.
You roll a die 48 times with the following results.
a. test statistic
b. critical value
Use a significance level of 0.05 to test the claim that the die is
fair.
 3) Find the test statistics x2 for the indicated goodness-of-fit test. (Do not write out the entire test) 3) Using the data below and a 0.05 significance level, test the claim that the responses occur with percentages of 15%, 20%, 25%, 25%, and 15% respectively. Response A B C D E Frequency 12 15 16 18 19 Fill out the table below and use it to find the test statistics x2. (0-E2 E 0 E O-E (0-E)2 +2=
 3) Find the test statistics x2 for the indicated goodness-of-fit test. (Do not write out the entire test) 3) Using the data below and a 0.05 significance level, test the claim that the responses occur with percentages of 15%, 20%, 25%, 25%, and 15% respectively. Response A B C D E Frequency 12 15 16 18 19 Fill out the table below and use it to find the test statistics x2. (0-E2 E 0 E O-E (0-E)2 +2=
 3) Find the test statistics x2 for the indicated goodness-of-fit test. (Do not write out the entire test) 3) Using the data below and a 0.05 significance level, test the claim that the responses occur with percentages of 15%, 20%, 25%, 25%, and 15% respectively. Response A B C D E Frequency 12 15 16 18 19 Fill out the table below and use it to find the test statistics x2. (0-E2 E 0 E O-E (0-E)2 +2=
 3) Find the test statistics x2 for the indicated goodness-of-fit test. (Do not write out the entire test) 3) Using the data below and a 0.05 significance level, test the claim that the responses occur with percentages of 15%, 20%, 25%, 25%, and 15% respectively. Response A B C D E Frequency 12 15 16 18 19 Fill out the table below and use it to find the test statistics x2. (0-E) E 0 E O-E (0-E) x2 = given...
Most questions answered within 3 hours.
-
3. Gains from trade
Consider two neighbouring island countries called Euphoria and
Contente. They each have...
asked 1 hour ago -
A business executive has the option to invest money in two
plans: Plan A guarantees that...
asked 3 hours ago -
Hello, can someone please help me answer this question?
How much heat is absorbed by a...
asked 3 hours ago -
. A marketing researcher conducted a survey of 25 shoppers
randomly selected at the local mall...
asked 3 hours ago -
Create an comprehensive response to the
following:
Antimicrobial agents work on a multitude of microbes (bacteria,...
asked 3 hours ago -
6.13 LAB: Step counter. Section 6.3.
A pedometer treats walking 2,000 steps as walking 1 mile....
asked 3 hours ago -
(14.2) A block of mass m = 10 kg riding on a frictionless
horizontal plane is...
asked 3 hours ago -
Use any search engine to search for articles about Starbucks
partnership with Tata Companies in India...
asked 3 hours ago -
Let’s say that for some reason Bank Excess Reserves suddenly
increase sharply. What effect would this...
asked 3 hours ago -
Given:
Curent Assets: $600,000
Total Assets: $2,600,000
Current Liabilities: $500,000
Total Liabilities: $1,700,000
What is the...
asked 4 hours ago -
1. What is a “Bankster”? What is insider trading? Why is it
illegal?
2. What is...
asked 4 hours ago -
A transverse wave on a cord is given by
D(x,t)=0.18sin(2.7x−61.0t), where Dand x are in m...
asked 4 hours ago