A consumer advocate researches the length of life between two brands of refrigerators, Brand A and...
A consumer advocate researches the length of life between two
brands of refrigerators, Brand A and Brand B. He collects data
(measured in years) on the longevity of 40 refrigerators for Brand
A and repeats the sampling for Brand B. These data are measured in
years. (You may find it useful to reference the appropriate
table: z table or t
table)
| Brand A | Brand B | Brand A | Brand B |
| 15 | 24 | 25 | 23 |
| 25 | 24 | 13 | 19 |
| 18 | 23 | 16 | 20 |
| 19 | 15 | 19 | 19 |
| 24 | 18 | 13 | 15 |
| 23 | 19 | 18 | 22 |
| 18 | 18 | 22 | 18 |
| 13 | 21 | 17 | 15 |
| 12 | 15 | 17 | 23 |
| 15 | 18 | 20 | 18 |
| 24 | 24 | 20 | 14 |
| 17 | 16 | 12 | 19 |
| 16 | 21 | 23 | 23 |
| 19 | 21 | 12 | 20 |
| 14 | 12 | 13 | 12 |
| 23 | 19 | 22 | 22 |
| 18 | 18 | 17 | 22 |
| 23 | 16 | 12 | 16 |
| 12 | 13 | 18 | 18 |
| 16 | 23 | 20 | 25 |
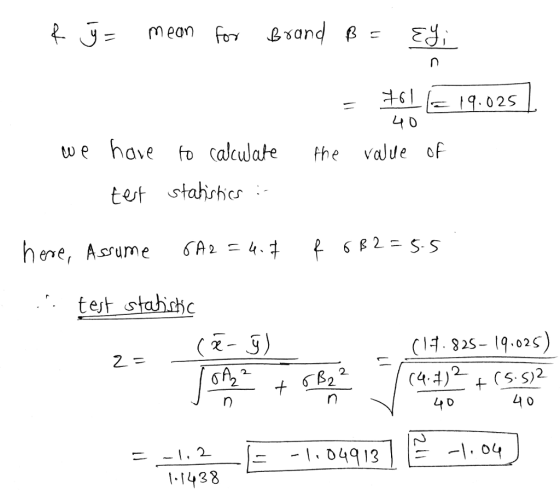
b-1. Calculate the value of the test statistic. Assume that σA2 = 4.7 and σB2 = 5.5. (Negative values should be indicated by a minus sign. Round intermediate calculations to at least 4 decimal places and final answer to 2 decimal places.
Homework Answers

Add Answer to:
A consumer advocate researches the length of life between two
brands of refrigerators, Brand A and...
A consumer advocate researches the length of life between two brands of refrigerators, Brand A and...
 A consumer advocate researches the length of life between two brands of refrigerators, Brand A and Brand B. He collects data (measured in years) on the longevity of 40 refrigerators for Brand A and repeats the sampling for Brand B. These data are measured in years. (You may find it useful to reference the appropriate table: z table or t table) Brand A Brand B Brand A Brand B 24 24 25 23 24 19 19 16 13 19 21...
Expert Q8A Done A consumer advocate researches the length of life between two brands of refrigerators,...
 Expert Q8A Done A consumer advocate researches the length of life between two brands of refrigerators, Brand A and Brand B. He collects data (measured in years) on the longevity of 40 refrigerators for Brand A and repeats the sampling for Brand B. These data are measured in years. (You may find it useful to reference the appropriate table: z table or t table) b-1. Calculate the value of the test statistic. Assume that σ42-4.7 and ơB2-64. (Negative values should...
rk Ass ghment Chapter 10 Exercise 10-17 Algo A consumer advocate researches the length of ife...
 rk Ass ghment Chapter 10 Exercise 10-17 Algo A consumer advocate researches the length of ife between two brands of refrigerators, Brand A and Brand B. He collects data (measured in years) on the longevity of 40 refrigerators for Brand A and repeats the sampling for Brand B. These data are measured in years (You may find it useful to reference the appropriate table: z table or ttable) 25 24 17 1335 13 2117 27 13 18 23 2 16...
Exercise 10-17 Algo ength of life between two brands of refmgerators, Brand A and Brand B....
 Exercise 10-17 Algo ength of life between two brands of refmgerators, Brand A and Brand B. He collects data years) on the longevty of 40 refrnigerators for Brand A and repeats the sampling for Brand B. These data are measured In years. (You may find It useful to reference the a ppropriate table: ztable or t table 25 14 int 13 12 25 1712 24 24 18 12 15 17 24 2321 16 13 12 23 23 18 14 13...
Help Save & Exit Check my A consumer advocate researches the length of life between two...
 Help Save & Exit Check my A consumer advocate researches the length of life between two brands of refrigerators, Brand A and Brand B. He collects data (measured in years) on the longevity of 40 refrigerators for Brand A and repeats the sampling for Brand B. These data are measured in years. (You may find it useful to reference the appropriate table: z table or table) 10 points Brand A Brand B Brand A Brand B eBook **************** 3322282292393282939 Click...
A doctor discovers a particular disease and determines the life expectancy is not good. He gathers...
A doctor discovers a particular disease and determines the life expectancy is not good. He gathers the data for his patents and posts it in the table below. The claims that the average life expectancy once the disease presents itself is less than 15 days. Check his claim and make an appropriate report about your findings Patient Days till passing Days -Patient # 1-24 2 -23 3 -13 4 -20 5 -10 6 -18 7 -13 8 -14 9 -24...
Consider the following data. 14 21 23 20 16 19 22 26 15 16 23 25...
Consider the following data. 14 21 23 20 16 19 22 26 15 16 23 25 24 20 15 20 19 20 21 13 17 17 18 23 26 21 22 15 20 18 25 24 15 23 25 19 21 24 21 19 (a) Develop a frequency distribution using classes of 12–14, 15–17, 18–20, 21–23, and 24–26. Class Frequency 12–14 15–17 18–20 21–23 24–26 Total (b) Develop a relative frequency distribution and a percent frequency distribution using the classes...
14 24 18 23 21 18 16 14 23 17 15 13 19 23 24 14...
14 24 18 23 21 18 16 14 23 17 15 13 19 23 24 14 16 26 21 14 15 22 16 12 20 23 19 26 20 25 21 19 21 25 23 25 25 19 20 15 (a) Develop a frequency distribution using classes of 12-14, 15-17, 18-20, 21-23, and 24-26. Class Frequency 12-14 15-17 18-20 21-23 24-26 Total (b) Develop a relative frequency distribution and a percent frequency distribution using the classes in part (a). If...
1 A measurement systems experiment involving 20 parts, three operators, and two measurements per ...
 1 A measurement systems experiment involving 20 parts, three operators, and two measurements per part is shown in Table 8E. 12. (a) Estimate the repeatability and reproducibility of the gauge (b) What is the estimate of total gauge variability? (c) If the product specifications are at LSL 6 and USIL - 60, what ca you say about gauge capa bility? TABLE 8E. 12 Measurement Data for Exercise 8.34 Operator 1 Operator 2 Operator 3 Measurements Measurements Measurements Part Number 1...
For the data listed(assume sample). a.) Find the following: Mean Mode Median Midrange Range Quartiles Variance...
For the data listed(assume sample). a.) Find the following: Mean Mode Median Midrange Range Quartiles Variance Standard Deviation BoxPlot b.) Create a frequency distribution When creating classes use the formula from the Notes on how classes to create. 17 23 14 16 12 26 20 22 14 15 22 18 18 21 21 19 15 21 18 17 15 25 14 30 16 10 20 12 16 17.44 16 14 15 20 20 16 17 16 15 15 19 48...
 A consumer advocate researches the length of life between two brands of refrigerators, Brand A and Brand B. He collects data (measured in years) on the longevity of 40 refrigerators for Brand A and repeats the sampling for Brand B. These data are measured in years. (You may find it useful to reference the appropriate table: z table or t table) Brand A Brand B Brand A Brand B 24 24 25 23 24 19 19 16 13 19 21...
 Expert Q8A Done A consumer advocate researches the length of life between two brands of refrigerators, Brand A and Brand B. He collects data (measured in years) on the longevity of 40 refrigerators for Brand A and repeats the sampling for Brand B. These data are measured in years. (You may find it useful to reference the appropriate table: z table or t table) b-1. Calculate the value of the test statistic. Assume that σ42-4.7 and ơB2-64. (Negative values should...
 rk Ass ghment Chapter 10 Exercise 10-17 Algo A consumer advocate researches the length of ife between two brands of refrigerators, Brand A and Brand B. He collects data (measured in years) on the longevity of 40 refrigerators for Brand A and repeats the sampling for Brand B. These data are measured in years (You may find it useful to reference the appropriate table: z table or ttable) 25 24 17 1335 13 2117 27 13 18 23 2 16...
 Exercise 10-17 Algo ength of life between two brands of refmgerators, Brand A and Brand B. He collects data years) on the longevty of 40 refrnigerators for Brand A and repeats the sampling for Brand B. These data are measured In years. (You may find It useful to reference the a ppropriate table: ztable or t table 25 14 int 13 12 25 1712 24 24 18 12 15 17 24 2321 16 13 12 23 23 18 14 13...
 Help Save & Exit Check my A consumer advocate researches the length of life between two brands of refrigerators, Brand A and Brand B. He collects data (measured in years) on the longevity of 40 refrigerators for Brand A and repeats the sampling for Brand B. These data are measured in years. (You may find it useful to reference the appropriate table: z table or table) 10 points Brand A Brand B Brand A Brand B eBook **************** 3322282292393282939 Click...
 1 A measurement systems experiment involving 20 parts, three operators, and two measurements per part is shown in Table 8E. 12. (a) Estimate the repeatability and reproducibility of the gauge (b) What is the estimate of total gauge variability? (c) If the product specifications are at LSL 6 and USIL - 60, what ca you say about gauge capa bility? TABLE 8E. 12 Measurement Data for Exercise 8.34 Operator 1 Operator 2 Operator 3 Measurements Measurements Measurements Part Number 1...
Most questions answered within 3 hours.
-
3. Gains from trade
Consider two neighbouring island countries called Euphoria and
Contente. They each have...
asked 33 minutes ago -
A business executive has the option to invest money in two
plans: Plan A guarantees that...
asked 2 hours ago -
Hello, can someone please help me answer this question?
How much heat is absorbed by a...
asked 2 hours ago -
. A marketing researcher conducted a survey of 25 shoppers
randomly selected at the local mall...
asked 3 hours ago -
Create an comprehensive response to the
following:
Antimicrobial agents work on a multitude of microbes (bacteria,...
asked 3 hours ago -
6.13 LAB: Step counter. Section 6.3.
A pedometer treats walking 2,000 steps as walking 1 mile....
asked 3 hours ago -
(14.2) A block of mass m = 10 kg riding on a frictionless
horizontal plane is...
asked 3 hours ago -
Use any search engine to search for articles about Starbucks
partnership with Tata Companies in India...
asked 3 hours ago -
Let’s say that for some reason Bank Excess Reserves suddenly
increase sharply. What effect would this...
asked 3 hours ago -
Given:
Curent Assets: $600,000
Total Assets: $2,600,000
Current Liabilities: $500,000
Total Liabilities: $1,700,000
What is the...
asked 3 hours ago -
1. What is a “Bankster”? What is insider trading? Why is it
illegal?
2. What is...
asked 3 hours ago -
A transverse wave on a cord is given by
D(x,t)=0.18sin(2.7x−61.0t), where Dand x are in m...
asked 3 hours ago