


Homework Answers
TOPIC:Z scores and Empirical rule.


Add Answer to:
Chapter 2, Section 3, Exercise 107 Percent Obese by State Computer output giving descriptive statistics for...
of Data, 2e PRINTE Cs for the percent of the population that is obese for each...
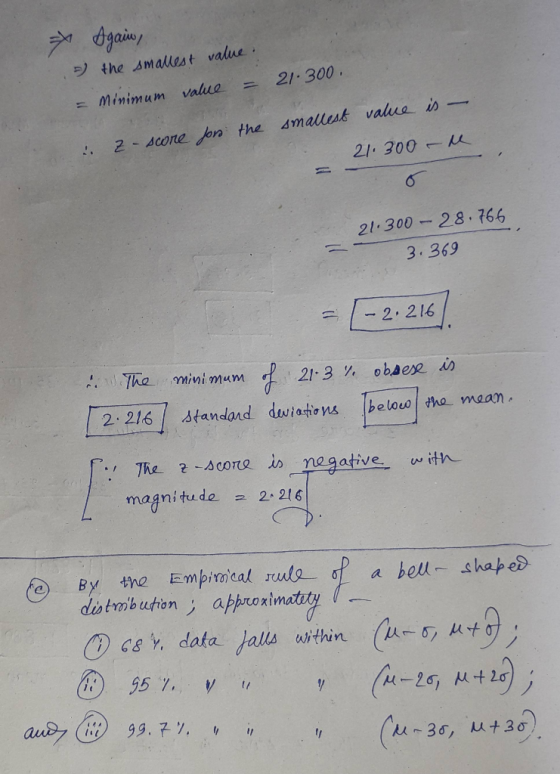
 of Data, 2e PRINTE Cs for the percent of the population that is obese for each of the 50 US states, from the USStates dataset, is given in the table shown below. S . Descriptive Statistics: Obese о N* Variable Мaximum Mean SE Mean Median StDev Minimum 50 28.766 3.369 29.400 35.100 0 0.476 21.300 26.375 31.150 Obese Percent of the population that is obese by state n this question. d deviation? се Assignment Gradebook ORION ent LINK TO TEXT...
Chapter 2, Section 3, Exercise 108 Five Number Summary for Percent Obese by State Computer output...
 Chapter 2, Section 3, Exercise 108 Five Number Summary for Percent Obese by State Computer output giving descriptive statistics for the percent of the population that is obese for each of the 50 US states, from the USStates dataset, is given in the table below. Descriptive Statistics: Obese Variable N N Mean SE Mean StDev Minimum Median 3 Maximum Obese 50 0 28.766 0.476 3.369 21.300 26.375 29.400 31.150 35.100 Percent of the population that is obese by state Click...
.wileyplus.com/euugerynuymanium S Lock, Statistics: Unlocking the Power of Data, 2e Help System Announcements ctice Assignment Gradebook...
 .wileyplus.com/euugerynuymanium S Lock, Statistics: Unlocking the Power of Data, 2e Help System Announcements ctice Assignment Gradebook ORION nment PRINTER VER Chapter 2, Section 3, Exercise 107 Percent Obese by State Computer output giving descriptive statistics for ti percent of the population that is obese for each of the 50 US states, from the USStates dataset, is given in the table shown below. Since included, this is a population, not a sample. Descriptive Statistics: Obese Variable N N* Mean SE Mean...
Chapter 2, Section 3, Exercise 118 Statistics for NBA Players in 2014-2015 The dataset NBAPlayers2015 contains...
 Chapter 2, Section 3, Exercise 118 Statistics for NBA Players in 2014-2015 The dataset NBAPlayers2015 contains information on many variables for players in the NBA (National Basketball Association) during the 2014-2015 season. The dataset includes information for all players who averaged more than 24 minutes per game, and includes n = 182 players and 24 variables Which Accomplishment of LeBron James is Most Impressive? The table below shows the means and standard deviations for four of the variables in the...
1.The two branches of statistics are (1.1) a) dependent and independent c) descriptive and inferential 2.When...
 1.The two branches of statistics are (1.1) a) dependent and independent c) descriptive and inferential 2.When we compute averages and standard deviations or graph data, we are b) population and sample d) ull and alternative workinq within a)descriptive statistics c) hypothesis testing 3. Which of the following groups is likely to have a lower standard deviation? b)inferential statistics d) statistical graphing (3.2) Group A: average heights of 13-year-old males Group B: average heights of 25-year old males a) Group A...
NE EXAM- Sampling and Descriptive Statistics Davon Brunes: Attempt 1 Question 8 (5 points) Match the...
 NE EXAM- Sampling and Descriptive Statistics Davon Brunes: Attempt 1 Question 8 (5 points) Match the following statements that refer to a bell-shaped data set. Within one standard deviation Approximately 68% of the data lie in this interval 1. of the mean Within three standard deviations of the mean Within two standard deviations of the mean Approximately 95% of the data lie in this interval 2. All or almost all of the data lie in this interval 3, Question 9...
Ch 03: Mastery Assignment - Descriptive Statistics: Numerical Measures < Back to Assignment Attempts: Average: 75...
 Ch 03: Mastery Assignment - Descriptive Statistics: Numerical Measures < Back to Assignment Attempts: Average: 75 6. Measures of variability Consider a data set containing the following values: 88 96 72 84 95 100 92 90 The smallest value is and the largest value is Therefore, the range is The first quartile is The third quartile is Therefore, the interquartile range (IQR) is The mean of the preceding values is 89.625. The deviations from the mean have been calculated: -1.625...
Chapter 2, Section 3, Exercise 109 Public Expenditure on Education The figure below shows the public...
 Chapter 2, Section 3, Exercise 109 Public Expenditure on Education The figure below shows the public expenditure on education as percentage of Gross Domestic Product (GDP) for all countries. 1 The mean expenditure is μ and the standard deviation of the expenditures is σ = 2%. The data are stored in EducationLiteracy 4.7% 10 12 1Data from The World Bank, the most recent data available for each country as of July 2015 obtained from knoema.com (a) The United States spends...
Consider a sample with 10 observations of 11, –3, 8, 8, 10, 1, –2, 13, 8,...
Consider a sample with 10 observations of 11, –3, 8, 8, 10, 1, –2, 13, 8, and –4. Use z-scores to determine if there are any outliers in the data; assume a bell-shaped distribution. (Round your answers to 2 decimal places. Negative values should be indicated by a minus sign.) The z-score for the smallest observation The z-score for the largest observation There are outliers or no outliers in the data. The historical returns on a portfolio had...
 of Data, 2e PRINTE Cs for the percent of the population that is obese for each of the 50 US states, from the USStates dataset, is given in the table shown below. S . Descriptive Statistics: Obese о N* Variable Мaximum Mean SE Mean Median StDev Minimum 50 28.766 3.369 29.400 35.100 0 0.476 21.300 26.375 31.150 Obese Percent of the population that is obese by state n this question. d deviation? се Assignment Gradebook ORION ent LINK TO TEXT...
 Chapter 2, Section 3, Exercise 108 Five Number Summary for Percent Obese by State Computer output giving descriptive statistics for the percent of the population that is obese for each of the 50 US states, from the USStates dataset, is given in the table below. Descriptive Statistics: Obese Variable N N Mean SE Mean StDev Minimum Median 3 Maximum Obese 50 0 28.766 0.476 3.369 21.300 26.375 29.400 31.150 35.100 Percent of the population that is obese by state Click...
 .wileyplus.com/euugerynuymanium S Lock, Statistics: Unlocking the Power of Data, 2e Help System Announcements ctice Assignment Gradebook ORION nment PRINTER VER Chapter 2, Section 3, Exercise 107 Percent Obese by State Computer output giving descriptive statistics for ti percent of the population that is obese for each of the 50 US states, from the USStates dataset, is given in the table shown below. Since included, this is a population, not a sample. Descriptive Statistics: Obese Variable N N* Mean SE Mean...
 Chapter 2, Section 3, Exercise 118 Statistics for NBA Players in 2014-2015 The dataset NBAPlayers2015 contains information on many variables for players in the NBA (National Basketball Association) during the 2014-2015 season. The dataset includes information for all players who averaged more than 24 minutes per game, and includes n = 182 players and 24 variables Which Accomplishment of LeBron James is Most Impressive? The table below shows the means and standard deviations for four of the variables in the...
 1.The two branches of statistics are (1.1) a) dependent and independent c) descriptive and inferential 2.When we compute averages and standard deviations or graph data, we are b) population and sample d) ull and alternative workinq within a)descriptive statistics c) hypothesis testing 3. Which of the following groups is likely to have a lower standard deviation? b)inferential statistics d) statistical graphing (3.2) Group A: average heights of 13-year-old males Group B: average heights of 25-year old males a) Group A...
 NE EXAM- Sampling and Descriptive Statistics Davon Brunes: Attempt 1 Question 8 (5 points) Match the following statements that refer to a bell-shaped data set. Within one standard deviation Approximately 68% of the data lie in this interval 1. of the mean Within three standard deviations of the mean Within two standard deviations of the mean Approximately 95% of the data lie in this interval 2. All or almost all of the data lie in this interval 3, Question 9...
 Ch 03: Mastery Assignment - Descriptive Statistics: Numerical Measures < Back to Assignment Attempts: Average: 75 6. Measures of variability Consider a data set containing the following values: 88 96 72 84 95 100 92 90 The smallest value is and the largest value is Therefore, the range is The first quartile is The third quartile is Therefore, the interquartile range (IQR) is The mean of the preceding values is 89.625. The deviations from the mean have been calculated: -1.625...
 Chapter 2, Section 3, Exercise 109 Public Expenditure on Education The figure below shows the public expenditure on education as percentage of Gross Domestic Product (GDP) for all countries. 1 The mean expenditure is μ and the standard deviation of the expenditures is σ = 2%. The data are stored in EducationLiteracy 4.7% 10 12 1Data from The World Bank, the most recent data available for each country as of July 2015 obtained from knoema.com (a) The United States spends...
Most questions answered within 3 hours.
-
(Expected rate of return and risk) Carter Inc. is evaluating a
security. Calculate the investment’s expected...
asked 49 minutes ago -
What specific indicators can point to lack of progress for
African Americans in American society?
asked 1 hour ago -
1-The Electrons in a beam are moving at 2.7×10⁸ m/s in an
electric field of 15000...
asked 2 hours ago -
A gas tank is a vertical cylinder. It has a radius of 1m, a
height of...
asked 2 hours ago -
Accent Software faces the following conditions. All of these
support Accent’s use of a market-penetration pricing...
asked 3 hours ago -
A mathematically inclined friend emails you the following
instructions: "Meet me in the cafeteria the first...
asked 3 hours ago -
A monopoly sells in two countries . The demand curves in the two
countries are p1...
asked 4 hours ago -
A .15kg rubber ball is bounced off a wall. Before hitting the
wall, the ball moves...
asked 5 hours ago -
A manufacturing company preparing to build a new plant is
considering three potential locations for it....
asked 5 hours ago -
B. If compound Y has approximately the same values of solubility
in toluene as compound X,...
asked 5 hours ago -
Oscar Inc. has inventory in Japan valued at 39,051,000 Yen one
year ago. One year ago...
asked 6 hours ago -
If Canada suffered from "fundamental disequilibrium," and its
government choose not to devalue its currency, a...
asked 6 hours ago