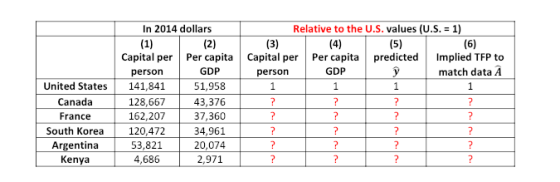
The table below reports per capita GDP and capital per person in the year 2014 for 10
countries. Your task is to fill in the missing columns of the table.
a)Given the values in column 1 and 2, fill in columns 3 and 4. That is, compute per capita GDP and capital per person relative to the U.S. values.
b)In column 5, use the production model (with a capital exponent of 1/3) to compute
predicted per capita GDP for each country relative to the United States, assuming there
are no TFP differences.
c)In column 6, compute the level of TFP for each country that is needed to match up the
model and the data.
d)Why do you think that A is close to one for some countries, but not for others?
Homework Answers
a).
Here we have given the values of “capital per person” and “Per capita GDP” for six different countries. So, here the “capital per person relative to U.S.” for different countries is the ratio of it’s own “capital per person” to “US”. Similarly, the “per capita GDP relative to U.S.” for different countries is the ratio of it’s own “per capita GDP” to “US”. So, on the basis of the given information we can calculate all these values.

b).
Now, the capital exponent is “1/3”, => labor exponent is “2/3”. So, the production function is given by, “Y=A*K^1/3*L^2/3”, => “y = A*k^1/3” in per worker form. Now, TFP factor is same for all country, => if want to get the predicted relative per capita GDP, then “A” term will cancel out for all country with US. So, the “predicted y” will be “capital per worker for different country relative to US” with exponent “1/3”. So, on the basis for the information in column “3” we can find out “5”.
c).
Now, to match the given data the TFP is the ratio of “actual y” to “predicted y”. So, on the basis of “4” and “5” we can get the “A”.
d).
Now, as we know that TFP is the ratio of “actual y” to “predicted y”, => if “A” is close to “1”, => “actual y” is close to “predicted y” => technological improvement is more or less same than expected. Similarly, if “A” is less than “1”, => “actual y” is less than the “predicted y”, => technological improvement is less than expected.
Add Answer to:
The table below reports per capita GDP and capital per person in
the year 2014 for...
1. Exercise 1. Predicting steady states and growth rates from Solow Model In this exercise, assume a = 1/3. Answer...
 1. Exercise 1. Predicting steady states and growth rates from Solow Model In this exercise, assume a = 1/3. Answer the following questions using the Solow model without population growth. a) First, assuming no differences in TFP. Assume that countries are in steady state. Following the Solow model, use the data in the table to predict the ratio of per capita GDP in each country relative to that in the US. Data Data Data Model (assume A = Aus) predicted...
1. Exercise 1. Predicting steady states and growth rates from Solow Model In this exercise, assume...
 1. Exercise 1. Predicting steady states and growth rates from Solow Model In this exercise, assume a, -1/3. Answer the following questions using the Solow model without population growth a) First, assuming no differences in TFP. Assume that countries are in steady state. Following the Solow model, use the data in the table to predict the ratio of per capita GDP in each country relative to that in the US. Data Data Data Countries Saving rate Model (assume A =...
Does the relationship between the initial level of real GDP per capita and the growth in...
 Does the relationship between
the initial level of real GDP per capita and the growth in real GDP
per capita for The United States, Western Europe, Canada, and Japan
from 1990 to 2014 support the catch-up hypothesis?
Question 22 (1 point) Does the relations hip between the ini tial level of real GDP per capita and the growth in real GDP per capita for The United S tates, Western Europe, Canada, and Japan from 1990 to 2014 support the catch-...
Does the relationship between
the initial level of real GDP per capita and the growth in real GDP
per capita for The United States, Western Europe, Canada, and Japan
from 1990 to 2014 support the catch-up hypothesis?
Question 22 (1 point) Does the relations hip between the ini tial level of real GDP per capita and the growth in real GDP per capita for The United S tates, Western Europe, Canada, and Japan from 1990 to 2014 support the catch-...
The following table lists 2012 GDP per capita for four countries. The data are given in...
 The following table lists 2012 GDP per capita for four countries. The data are given in the national currencies of the countries. It also lists the price of a Big Mac in local currency in each country in 2012. The price of a Big Mac in the United States in 2012 was $4.10. Using the Big Mac as a representative commodity common to the countries, calculato the purchasing power parity (PPP-adjustment factor for each country (S/units of foreign currency), and...
[Use the information below to compare Switzerland (SWI), India (IND), and the United States (USA) in...
 [Use the information below to compare Switzerland (SWI), India (IND), and the United States (USA) in per capita terms, adjusted for price differences. You are given the following data table. Fill in the missing values. Population (column A) and GDP (D) are in millions. GDP in column D is in domestic currency, the Franc in Switzerland, the Rupee in India, and the U.S. dollar for the United States. The exchange rate (B) is units of foreign currency per U.S. $1,...
The following table lists gross domestic product (GDP) and approximate population for four countries in 2013....
 The following table lists gross domestic product (GDP) and approximate population for four countries in 2013. Note that GDP is given in millions of U.S dollars (USD). For example, a value of 16,800,000 suggests that U.S. GDP was approximately $16.8 trillion in 2013. GDP per capita, however, is simply given in dollars (USD) Calculate GDP per capita for each country and enter it in the fourth column of the table GDP per capita (USD) GDP France Liberia India United States...
ntent attribution QUESTION 21 . 1 POINT Using the table below, calculate the GDP per capita...
 ntent attribution QUESTION 21 . 1 POINT Using the table below, calculate the GDP per capita for Country B. Round your answer to the nearest dollar. Country GDP per capita GDP Population (in billions of U.S. dollars) (in millions) $1,200 350 $1,800 615 $3,680 1,250 $34,800 1,200 B с D GDP per capita (in U.S. dollars) ? ? ? ? rovide your answer below: GDP per capita = 8
Based on information from the World Bank, in 2016, GDP per capita was $57,467 in the...
Based on information from the World Bank, in 2016, GDP per capita was $57,467 in the United States and $59,977 in Iceland – very similar values (and high values compared to many countries). But, the annual rate of GDP growth averages 0.9% in the United States and 6.1% in Iceland. Would you predict the United States or Iceland to have a more rapid increase in the standard of living in the long run? _________________ Discuss what evidence/theory from Chapter 11...
9.15. Based on data in Table 9-1 and the rule of 70, if U.S. per capita...
 9.15. Based on data in Table 9-1 and the rule of 70, if U.S. per capita real GDP continues to grow at the average rate it has experienced since 1990, about how many years will be required for it to double? TABLE 9-1 Per Capita Real GDP Growth Rates in Various Countries Average Annual Rate of Growth of Real Country GDP Per Capita, 1990-2017 (%) Japan 0.8 France 0.9 Germany 1.4 Canada 1.4 Sweden 1.5 United States Turkey Chile 3.7...
7. How large is the economy of India? Indian GDP in 2014 was 119 trillion rupees,...
 7. How large is the economy of India? Indian GDP in 2014 was 119 trillion rupees, while U.S. GDP was $16.5 trillion. The exchange rate in 2014 was 61.0 rupees per dollar. India turns out to have lower prices than the United States (this is true more generally for poor countries): the price level in India (converted to dollars) divided by the price level in the United States was 0.280 in 2014. (a) What is the ratio of Indian GDP...
 1. Exercise 1. Predicting steady states and growth rates from Solow Model In this exercise, assume a = 1/3. Answer the following questions using the Solow model without population growth. a) First, assuming no differences in TFP. Assume that countries are in steady state. Following the Solow model, use the data in the table to predict the ratio of per capita GDP in each country relative to that in the US. Data Data Data Model (assume A = Aus) predicted...
 1. Exercise 1. Predicting steady states and growth rates from Solow Model In this exercise, assume a, -1/3. Answer the following questions using the Solow model without population growth a) First, assuming no differences in TFP. Assume that countries are in steady state. Following the Solow model, use the data in the table to predict the ratio of per capita GDP in each country relative to that in the US. Data Data Data Countries Saving rate Model (assume A =...
 Does the relationship between
the initial level of real GDP per capita and the growth in real GDP
per capita for The United States, Western Europe, Canada, and Japan
from 1990 to 2014 support the catch-up hypothesis?
Question 22 (1 point) Does the relations hip between the ini tial level of real GDP per capita and the growth in real GDP per capita for The United S tates, Western Europe, Canada, and Japan from 1990 to 2014 support the catch-...
Does the relationship between
the initial level of real GDP per capita and the growth in real GDP
per capita for The United States, Western Europe, Canada, and Japan
from 1990 to 2014 support the catch-up hypothesis?
Question 22 (1 point) Does the relations hip between the ini tial level of real GDP per capita and the growth in real GDP per capita for The United S tates, Western Europe, Canada, and Japan from 1990 to 2014 support the catch-...
 The following table lists 2012 GDP per capita for four countries. The data are given in the national currencies of the countries. It also lists the price of a Big Mac in local currency in each country in 2012. The price of a Big Mac in the United States in 2012 was $4.10. Using the Big Mac as a representative commodity common to the countries, calculato the purchasing power parity (PPP-adjustment factor for each country (S/units of foreign currency), and...
 [Use the information below to compare Switzerland (SWI), India (IND), and the United States (USA) in per capita terms, adjusted for price differences. You are given the following data table. Fill in the missing values. Population (column A) and GDP (D) are in millions. GDP in column D is in domestic currency, the Franc in Switzerland, the Rupee in India, and the U.S. dollar for the United States. The exchange rate (B) is units of foreign currency per U.S. $1,...
 The following table lists gross domestic product (GDP) and approximate population for four countries in 2013. Note that GDP is given in millions of U.S dollars (USD). For example, a value of 16,800,000 suggests that U.S. GDP was approximately $16.8 trillion in 2013. GDP per capita, however, is simply given in dollars (USD) Calculate GDP per capita for each country and enter it in the fourth column of the table GDP per capita (USD) GDP France Liberia India United States...
 ntent attribution QUESTION 21 . 1 POINT Using the table below, calculate the GDP per capita for Country B. Round your answer to the nearest dollar. Country GDP per capita GDP Population (in billions of U.S. dollars) (in millions) $1,200 350 $1,800 615 $3,680 1,250 $34,800 1,200 B с D GDP per capita (in U.S. dollars) ? ? ? ? rovide your answer below: GDP per capita = 8
 9.15. Based on data in Table 9-1 and the rule of 70, if U.S. per capita real GDP continues to grow at the average rate it has experienced since 1990, about how many years will be required for it to double? TABLE 9-1 Per Capita Real GDP Growth Rates in Various Countries Average Annual Rate of Growth of Real Country GDP Per Capita, 1990-2017 (%) Japan 0.8 France 0.9 Germany 1.4 Canada 1.4 Sweden 1.5 United States Turkey Chile 3.7...
 7. How large is the economy of India? Indian GDP in 2014 was 119 trillion rupees, while U.S. GDP was $16.5 trillion. The exchange rate in 2014 was 61.0 rupees per dollar. India turns out to have lower prices than the United States (this is true more generally for poor countries): the price level in India (converted to dollars) divided by the price level in the United States was 0.280 in 2014. (a) What is the ratio of Indian GDP...
Most questions answered within 3 hours.
-
MARKET EFFICIENCY IN-CLASS WORKSHEET 2 This question examines
the market for peanut butter. You will use...
asked 6 minutes ago -
An ideal gas (which is is a hypothetical gas that conforms to
the laws governing gas...
asked 9 minutes ago -
. If economic profits exist in perfect competition, in the long
run firms will enter because...
asked 14 minutes ago -
calculate the oxidation state of carbons C18H36O2 and
C18H36018
and then calculated the number of electrons...
asked 28 minutes ago -
Please respond to each of the below questions in a minimum of 5
well written paragraphs...
asked 22 minutes ago -
On January 1, Year 1, Brown Co. issued bonds with a face value
of $115,000, a...
asked 27 minutes ago -
It is better to optimize alpha by using trial and error methods
or by using methods...
asked 35 minutes ago -
An urn contains 39 red, 17 white and 30 blue marbles. A child
selects two marbles...
asked 38 minutes ago -
A student conducting this experiment weighs out 2.80 g of
CoCl2.6H2O.
For this part you will...
asked 45 minutes ago -
A cube, 100.0m on a side, has a total charge of 12.0 nC
distributed uniformly on...
asked 35 minutes ago -
Let's consider that two hockey players with equal mass, moving
with the same speed of 10...
asked 37 minutes ago -
Find the mid-range for the given sample data. Listed
below are the amounts of time (in...
asked 54 minutes ago