
Homework Answers

Add Answer to:
The following table lists 2012 GDP per capita for four countries. The data are given in...
It says one or more of my answers are wrong. The following table lists 2012 GDP...
 It says one or more of my answers are
wrong.
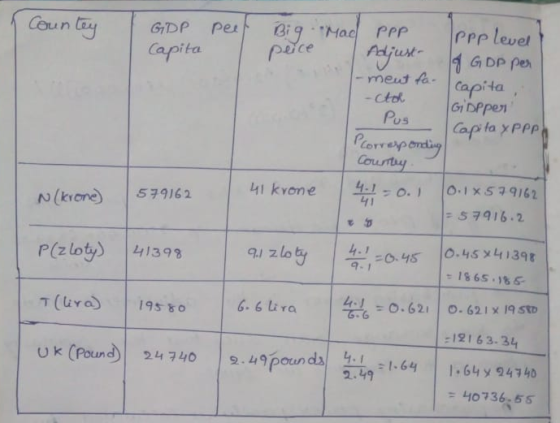
The following table lists 2012 GDP per capita for four countries. The data are given in the national currencies of the countries. It also lists the price of a Big Mac in local currency in each country in 2012. The price of a Big Mac in the United States in 2012 was $4.10. Using the Big Mac as a representative commodity common to the countries, calculate the purchasing power parity...
It says one or more of my answers are
wrong.
The following table lists 2012 GDP per capita for four countries. The data are given in the national currencies of the countries. It also lists the price of a Big Mac in local currency in each country in 2012. The price of a Big Mac in the United States in 2012 was $4.10. Using the Big Mac as a representative commodity common to the countries, calculate the purchasing power parity...
Suppose that when converting to the same currency values, the nominal GDP per capita in the...
 Suppose that when converting to the same currency values, the nominal GDP per capita in the fictional country of Islandia is 25 percent higher than the nominal GDP per capita in the fictional country of Mountainia. However, the purchasing power for the same amount of Islandia currency is about 40 percent lower in Islandia than in Mountainia. If we use Islandia as the base country for comparison, the PPP-adjusted GDP per capita in Mountainia i(Click to select) ts nominal GDP....
The following table lists gross domestic product (GDP) and approximate population for four countries in 2013....
 The following table lists gross domestic product (GDP) and approximate population for four countries in 2013. Note that GDP is given in millions of U.S dollars (USD). For example, a value of 16,800,000 suggests that U.S. GDP was approximately $16.8 trillion in 2013. GDP per capita, however, is simply given in dollars (USD) Calculate GDP per capita for each country and enter it in the fourth column of the table GDP per capita (USD) GDP France Liberia India United States...
8. Purchasing-power parity Using data from The Economist's Big Mac Index for 2016, the following table...
 8. Purchasing-power parity Using data from The Economist's Big Mac Index for 2016, the following table shows the local currency price of a Big Mac in several countries as well as the actual exchange rate between each country and the United States. At the time of the data collection, a Big Mac would have cost you $4.93 in the United States and GBP 2.89 in the United Kingdom. The actual exchange rate between the British pound and the U.S. dollar was...
8. Purchasing-power parity Using data from The Economist's Big Mac Index for 2016, the following ...
8. Purchasing-power parity Using data from The Economist's Big Mac Index for 2016, the following table shows the local currency price of a Big Mac in several countries as well as the actual exchange rate between each country and the United States. At the time of the data collection, a Big Mac would have cost you $4.93 in the United States and GBP 2.89 in the United Kingdom. The actual exchange rate between the British pound and the U.S. dollar...
Using data from The Economist's Big Mac Index for 2016, the following table shows the local...
 Using data from The Economist's Big Mac Index for 2016, the following table shows the local currency price of a Big Mac in several countries as well as the actual exchange rate between each country and the United States. At the time of the data collection, a Big Mac would have cost you $4.93 in the United States and GBP 2.89 in the United Kingdom. The actual exchange rate between the British pound and the U.S. dollar was $1.63 per...
8. Purchasing-power parity Using data from The Economist's Big Mac Index for 2016, the following table...
 8. Purchasing-power parity
Using data from The Economist's Big Mac Index for 2016,
the following table shows the local currency price of a Big Mac in
several countries as well as the actual exchange rate between each
country and the United States. At the time of the data collection,
a Big Mac would have cost you $4.93 in the United States and GBP
2.89 in the United Kingdom. The actual exchange rate between the
British pound and the U.S. dollar...
8. Purchasing-power parity
Using data from The Economist's Big Mac Index for 2016,
the following table shows the local currency price of a Big Mac in
several countries as well as the actual exchange rate between each
country and the United States. At the time of the data collection,
a Big Mac would have cost you $4.93 in the United States and GBP
2.89 in the United Kingdom. The actual exchange rate between the
British pound and the U.S. dollar...
6. Purchasing power parity Using data from The Economist's Big Mac Index for 2011, the following...
6. Purchasing power parity Using data from The Economist's Big Mac Index for 2011, the following table shows the local currency price of a Big Mac in several countries as well as the actual exchange rate between each country and the United States. At the time of the data collection, a Big Mac would have cost you $4.07 in the United States and GBP 2.39 in the United Kingdom. The actual exchange rate between the British pound and the U.S. dollar...
2. The following table lists GDP per capita from 1970 to 2010 for South Korea and...
 2. The following table lists GDP per capita from 1970 to 2010 for South Korea and the United States. As you can see, both grew substantially over that 40-year period Year South Korea GDP per Capita U.S. GDP per Capita 1970 1980 |1990 2000 2010 317 5247 1778 12598 6642 11948 22151 23955 36467 48358 [Data from the World Bank, World Development Indicators] a.Plot the five data points for each country on a graph using a nonproportional scale, as in...
The table below reports per capita GDP and capital per person in the year 2014 for...
 The table below reports per capita GDP and capital per person in
the year 2014 for 10
countries. Your task is to fill in the missing columns of the
table.
a)Given the values in column 1 and 2, fill in columns 3 and 4.
That is, compute per capita GDP and capital per person relative to
the U.S. values.
b)In column 5, use the production model (with a capital exponent
of 1/3) to compute
predicted per capita GDP for each...
The table below reports per capita GDP and capital per person in
the year 2014 for 10
countries. Your task is to fill in the missing columns of the
table.
a)Given the values in column 1 and 2, fill in columns 3 and 4.
That is, compute per capita GDP and capital per person relative to
the U.S. values.
b)In column 5, use the production model (with a capital exponent
of 1/3) to compute
predicted per capita GDP for each...
 It says one or more of my answers are
wrong.
The following table lists 2012 GDP per capita for four countries. The data are given in the national currencies of the countries. It also lists the price of a Big Mac in local currency in each country in 2012. The price of a Big Mac in the United States in 2012 was $4.10. Using the Big Mac as a representative commodity common to the countries, calculate the purchasing power parity...
It says one or more of my answers are
wrong.
The following table lists 2012 GDP per capita for four countries. The data are given in the national currencies of the countries. It also lists the price of a Big Mac in local currency in each country in 2012. The price of a Big Mac in the United States in 2012 was $4.10. Using the Big Mac as a representative commodity common to the countries, calculate the purchasing power parity...
 Suppose that when converting to the same currency values, the nominal GDP per capita in the fictional country of Islandia is 25 percent higher than the nominal GDP per capita in the fictional country of Mountainia. However, the purchasing power for the same amount of Islandia currency is about 40 percent lower in Islandia than in Mountainia. If we use Islandia as the base country for comparison, the PPP-adjusted GDP per capita in Mountainia i(Click to select) ts nominal GDP....
 The following table lists gross domestic product (GDP) and approximate population for four countries in 2013. Note that GDP is given in millions of U.S dollars (USD). For example, a value of 16,800,000 suggests that U.S. GDP was approximately $16.8 trillion in 2013. GDP per capita, however, is simply given in dollars (USD) Calculate GDP per capita for each country and enter it in the fourth column of the table GDP per capita (USD) GDP France Liberia India United States...
 8. Purchasing-power parity Using data from The Economist's Big Mac Index for 2016, the following table shows the local currency price of a Big Mac in several countries as well as the actual exchange rate between each country and the United States. At the time of the data collection, a Big Mac would have cost you $4.93 in the United States and GBP 2.89 in the United Kingdom. The actual exchange rate between the British pound and the U.S. dollar was...
 Using data from The Economist's Big Mac Index for 2016, the following table shows the local currency price of a Big Mac in several countries as well as the actual exchange rate between each country and the United States. At the time of the data collection, a Big Mac would have cost you $4.93 in the United States and GBP 2.89 in the United Kingdom. The actual exchange rate between the British pound and the U.S. dollar was $1.63 per...
 8. Purchasing-power parity
Using data from The Economist's Big Mac Index for 2016,
the following table shows the local currency price of a Big Mac in
several countries as well as the actual exchange rate between each
country and the United States. At the time of the data collection,
a Big Mac would have cost you $4.93 in the United States and GBP
2.89 in the United Kingdom. The actual exchange rate between the
British pound and the U.S. dollar...
8. Purchasing-power parity
Using data from The Economist's Big Mac Index for 2016,
the following table shows the local currency price of a Big Mac in
several countries as well as the actual exchange rate between each
country and the United States. At the time of the data collection,
a Big Mac would have cost you $4.93 in the United States and GBP
2.89 in the United Kingdom. The actual exchange rate between the
British pound and the U.S. dollar...
 2. The following table lists GDP per capita from 1970 to 2010 for South Korea and the United States. As you can see, both grew substantially over that 40-year period Year South Korea GDP per Capita U.S. GDP per Capita 1970 1980 |1990 2000 2010 317 5247 1778 12598 6642 11948 22151 23955 36467 48358 [Data from the World Bank, World Development Indicators] a.Plot the five data points for each country on a graph using a nonproportional scale, as in...
 The table below reports per capita GDP and capital per person in
the year 2014 for 10
countries. Your task is to fill in the missing columns of the
table.
a)Given the values in column 1 and 2, fill in columns 3 and 4.
That is, compute per capita GDP and capital per person relative to
the U.S. values.
b)In column 5, use the production model (with a capital exponent
of 1/3) to compute
predicted per capita GDP for each...
The table below reports per capita GDP and capital per person in
the year 2014 for 10
countries. Your task is to fill in the missing columns of the
table.
a)Given the values in column 1 and 2, fill in columns 3 and 4.
That is, compute per capita GDP and capital per person relative to
the U.S. values.
b)In column 5, use the production model (with a capital exponent
of 1/3) to compute
predicted per capita GDP for each...
Most questions answered within 3 hours.
-
Use Microsoft Excel to determine the rate of return for a
project that has an initial...
asked 7 minutes ago -
During Heaton Company’s first two years of operations, it
reported absorption costing net operating income as...
asked 5 minutes ago -
A 63kg client has been told to cycle at 60% of her 7 MET
capacity. What...
asked 16 minutes ago -
A laser beam is incident on two slits with a separation of 0.215
mm, and a...
asked 22 minutes ago -
if(qtySold > QUOTA)
bonusPay = 50;
totalPay = regPay + bonusPay;
System.out.println("Your totalPay amount is "...
asked 22 minutes ago -
A sample of 100 units showed a sample mean 12 oz with a standard
deviation 3...
asked 23 minutes ago -
Investors who find out what shares Warren Buffett, a famous
investor, is buying or selling to...
asked 37 minutes ago -
b) Compute the mean for all 5 Upper C 2 equals 10 samples with
size nequals2....
asked 44 minutes ago -
Giving a test to a group of students, the grades and gender are
summarized below A...
asked 47 minutes ago -
The ["VTP", "SNMP", "SMTP", "IPX"]
protocol is used by a collection of
switches...
asked 45 minutes ago -
MnO−4 reacts with
Fe2+ in acid solution to produce
Fe3+ and Mn2+. Write a balanced
equation...
asked 47 minutes ago -
Are some number of occupational illnesses and injuries an
acceptable part of doing business? Why or...
asked 1 hour ago