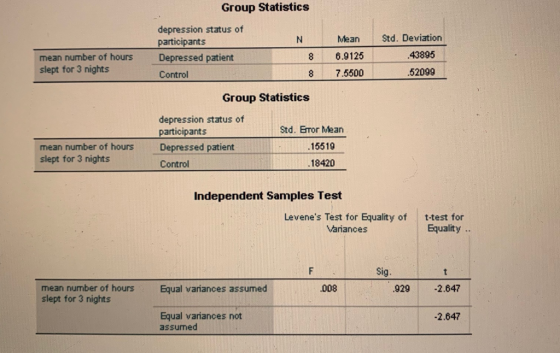
2. Look at the Independent samples t-test table to get your t calculated, df, and significance. Read the line that says “equal variances assumed”. Remember that significance level will appear in the Sig (2-tailed) column. Any value that is smaller than .05 will be significant at the .05 level or higher. In a sentence describe the results and report them in APA style, including r2 and evaluation (you will need to calculate r2 by hand).
3. What type of error in hypothesis testing is possible given the above result? How likely is this error given r2?
Homework Answers
2.
Add Answer to:
2. Look at the Independent samples t-test table to get your t
calculated, df, and significance....
Look at the table for the Paired samples test to find your t calculated, df, and...
 Look at the table for the Paired samples test to find your t
calculated, df, and significance. Remember that significance level
will appear in the Sig (2-tailed) column. Any value that is smaller
than .05 will be significant at the .05 level or higher. In a
sentence describe the results and report them in APA style,
including r2 and evaluation (you will need to calculate
r2 by hand).
3. What type of error in hypothesis testing is possible given
the...
Look at the table for the Paired samples test to find your t
calculated, df, and significance. Remember that significance level
will appear in the Sig (2-tailed) column. Any value that is smaller
than .05 will be significant at the .05 level or higher. In a
sentence describe the results and report them in APA style,
including r2 and evaluation (you will need to calculate
r2 by hand).
3. What type of error in hypothesis testing is possible given
the...
spss output for questions 34, 35 & 36 Group Statistics Gender Mean Std. Deviation Std. Error Mean Loneliness Female 112 35.0000 86394 44 35.0000 7.95335 Independent Samples Test Levene's...
 spss output for questions 34, 35 & 36 Group Statistics Gender Mean Std. Deviation Std. Error Mean Loneliness Female 112 35.0000 86394 44 35.0000 7.95335 Independent Samples Test Levene's Test for Equality of Variances Hest for Equality of Means 95% Confdence Interval of the Sig. (2 Mean Std. Emor Ditlerence df taled) Difference DiflerenceLower Upper Sig. Loneliness Equal variances 1021 .0001 1541 10여 .000001100707|-329329 320320 2.7 assumed 091.000 00000 151867301416 3.01416 Equal variances not assumed 34. For the above SPSS...
ONLY QUESTIONS D, E, F and G Question 3: Independent Samples t-Test Group Statistics bype of...
 ONLY QUESTIONS D, E, F and G
Question 3: Independent Samples t-Test Group Statistics bype of school Mean reading score public private 168 32 51.8452 54.2500 SM Deviation 10.42279 9 19677 Sid Error Mean 0414 162578 Independent Samples Test Levene's Test for Equality of Variances t-test for Equality of Means 95% Confidence Mean Sid. Error Interval of the Sig. 2. Differenc Differenc Difference o tailed) Lower Upper 564 453 1.217 198 225 -2.40476 1.97519 -6.29986 1.49034 reading Equal variances assumed...
ONLY QUESTIONS D, E, F and G
Question 3: Independent Samples t-Test Group Statistics bype of school Mean reading score public private 168 32 51.8452 54.2500 SM Deviation 10.42279 9 19677 Sid Error Mean 0414 162578 Independent Samples Test Levene's Test for Equality of Variances t-test for Equality of Means 95% Confidence Mean Sid. Error Interval of the Sig. 2. Differenc Differenc Difference o tailed) Lower Upper 564 453 1.217 198 225 -2.40476 1.97519 -6.29986 1.49034 reading Equal variances assumed...
spss output for questions 34, 35 & 36 Group Statistics Gender Mean Std. Deviation Std. Ermor Mean Loneliness Female 112 35.0000 44 35.0000 7.95335 Independent Samples Test Levene's Test...
 spss output for questions 34, 35 & 36 Group Statistics Gender Mean Std. Deviation Std. Ermor Mean Loneliness Female 112 35.0000 44 35.0000 7.95335 Independent Samples Test Levene's Test for Equality of Variances Hest for Equality of Means 95% Confdence Interval of the Sig (2 Mean Std. Emor Ditterence df taled) Difference DilerenceLower Upper , 54 1.000 000000 1,039320 Loneliness Equal variances 02000 2.709 assumed 000 969541 1.000丨 .00000| 151867|-301416| 301410 Equal variances 06. not assumed 31. For the above...
QUESTION 1 "Look at the SPSS output below. Given a two-tailed test and an alpha of...
 QUESTION 1 "Look at the SPSS output below. Given a two-tailed test and an alpha of 0.01, what would the appropriate APA-style phrase be?" Independent Samples Test Levene's Test for Equality of Variances t-test for Equality of Means sig Mean Difference Std. Error Difference 95% Confidence Interval of the Mean Lower Upper sig (2-tailed) TAPSPEED 319 582 -2.845 13 .014 -14.00 4.92 -24.63 -3.37 Equal variances assumed Equal variances not assumed -2.927 11.865 013 -14.00 4.78 -24.44 -3.56 O "t...
QUESTION 12 Using the SPSS output below, which of the following statements is correct? Independent Samples...
 QUESTION 12 Using the SPSS output below, which of the following statements is correct? Independent Samples Test Levene's Test for Equality of Variances t-test for Equality of Means 95% Confidence Interval of the Difference Mean F Sig t df Sig. (2- tailed) Std. Error Difference Difference Lower Upper Equal variances assumed 1.429 280 2.145 10 058 6.00000 2.79682 - 23171 12.23171 Equal variances not 2.145 0.461 050 6.00000 2.79082 - 28015 12.28015 assumed The assumption of homogeneity of variance was...
The output below is for a t-test for the hypothesis: Individuals living in bad neighborhoods commit...
 The output below is for a t-test for the hypothesis: Individuals
living in bad neighborhoods commit more crime than those living in
good neighborhoods. The data in the Group Statistics section
provides you with the average number of crimes committed by
individuals living in good and bad neighborhoods and the standard
deviation of this same variable. The findings of significance are
located in the Independent Samples Test section. Pay particular
attention to the "t" column and the "Sig (2-tailed)"column. The...
The output below is for a t-test for the hypothesis: Individuals
living in bad neighborhoods commit more crime than those living in
good neighborhoods. The data in the Group Statistics section
provides you with the average number of crimes committed by
individuals living in good and bad neighborhoods and the standard
deviation of this same variable. The findings of significance are
located in the Independent Samples Test section. Pay particular
attention to the "t" column and the "Sig (2-tailed)"column. The...
Problem Set 1: The independent-samples t test Research Scenario: A learning psychologist is interested in comparing the success of two different mnemonics (memorization methods) on performance in a me...
Problem Set 1: The independent-samples t test Research Scenario: A learning psychologist is interested in comparing the success of two different mnemonics (memorization methods) on performance in a memory task. He assigns students to two groups, one which learns and uses a language-based rhyming memory technique, and one which learns and uses a visual “method of loci” spatial memory technique. He then administers a memory task to each group of students. The students are scored based on the percentage of...
Do males and females have significant different GPAs? Following is the output of analysis for 26...
 Do males and females have significant different GPAs? Following is
the output of analysis for 26 males and 25 females.
1. Which of the following statements are true regarding
Levene’s F-test using a .05 level of significance?
a. Means are significantly different
b. Means are not significantly different
c. Variances are significantly different
d.Variances are not significantly different
2. From the chart above, what is the correct t-value, df, and Sig.
used for the t-test:
a. t(49)=0.326, p>0.05
b.t(49)=0.330, p>0.05...
Do males and females have significant different GPAs? Following is
the output of analysis for 26 males and 25 females.
1. Which of the following statements are true regarding
Levene’s F-test using a .05 level of significance?
a. Means are significantly different
b. Means are not significantly different
c. Variances are significantly different
d.Variances are not significantly different
2. From the chart above, what is the correct t-value, df, and Sig.
used for the t-test:
a. t(49)=0.326, p>0.05
b.t(49)=0.330, p>0.05...
SET Took None Small=0.0001 SUGRY=Hone THREADS AUTO TriBoth DIGITGROUPING NO LEADEROS TABLERENDER=light. T-TEST GROUPS-sex(12) /MISSINGEANALYSIS /...
 SET Took None Small=0.0001 SUGRY=Hone THREADS AUTO TriBoth DIGITGROUPING NO LEADEROS TABLERENDER=light. T-TEST GROUPS-sex(12) /MISSINGEANALYSIS / VARIABLES-hral CRITERIA CI(.95). T-Test [DataSetl] E:\TEACHING\00304\2012_GSS Data setsav Group Statistics RESPONDENTS SEX MALE Std Dewi NUMBER OF HOURS WORKED LAST WEEK Sid Em N 432 425 Mean 20 35 85 1 FEMALE 4 677 15 216 Independent Samples Test Levene's Test for Equality of Variances est for Equality of Neang Con Derence the Si tie Sidemar Denta NUMBER OF HOURS WORKED LAST WEEK Mean...
 Look at the table for the Paired samples test to find your t
calculated, df, and significance. Remember that significance level
will appear in the Sig (2-tailed) column. Any value that is smaller
than .05 will be significant at the .05 level or higher. In a
sentence describe the results and report them in APA style,
including r2 and evaluation (you will need to calculate
r2 by hand).
3. What type of error in hypothesis testing is possible given
the...
Look at the table for the Paired samples test to find your t
calculated, df, and significance. Remember that significance level
will appear in the Sig (2-tailed) column. Any value that is smaller
than .05 will be significant at the .05 level or higher. In a
sentence describe the results and report them in APA style,
including r2 and evaluation (you will need to calculate
r2 by hand).
3. What type of error in hypothesis testing is possible given
the...
 spss output for questions 34, 35 & 36 Group Statistics Gender Mean Std. Deviation Std. Error Mean Loneliness Female 112 35.0000 86394 44 35.0000 7.95335 Independent Samples Test Levene's Test for Equality of Variances Hest for Equality of Means 95% Confdence Interval of the Sig. (2 Mean Std. Emor Ditlerence df taled) Difference DiflerenceLower Upper Sig. Loneliness Equal variances 1021 .0001 1541 10여 .000001100707|-329329 320320 2.7 assumed 091.000 00000 151867301416 3.01416 Equal variances not assumed 34. For the above SPSS...
 ONLY QUESTIONS D, E, F and G
Question 3: Independent Samples t-Test Group Statistics bype of school Mean reading score public private 168 32 51.8452 54.2500 SM Deviation 10.42279 9 19677 Sid Error Mean 0414 162578 Independent Samples Test Levene's Test for Equality of Variances t-test for Equality of Means 95% Confidence Mean Sid. Error Interval of the Sig. 2. Differenc Differenc Difference o tailed) Lower Upper 564 453 1.217 198 225 -2.40476 1.97519 -6.29986 1.49034 reading Equal variances assumed...
ONLY QUESTIONS D, E, F and G
Question 3: Independent Samples t-Test Group Statistics bype of school Mean reading score public private 168 32 51.8452 54.2500 SM Deviation 10.42279 9 19677 Sid Error Mean 0414 162578 Independent Samples Test Levene's Test for Equality of Variances t-test for Equality of Means 95% Confidence Mean Sid. Error Interval of the Sig. 2. Differenc Differenc Difference o tailed) Lower Upper 564 453 1.217 198 225 -2.40476 1.97519 -6.29986 1.49034 reading Equal variances assumed...
 spss output for questions 34, 35 & 36 Group Statistics Gender Mean Std. Deviation Std. Ermor Mean Loneliness Female 112 35.0000 44 35.0000 7.95335 Independent Samples Test Levene's Test for Equality of Variances Hest for Equality of Means 95% Confdence Interval of the Sig (2 Mean Std. Emor Ditterence df taled) Difference DilerenceLower Upper , 54 1.000 000000 1,039320 Loneliness Equal variances 02000 2.709 assumed 000 969541 1.000丨 .00000| 151867|-301416| 301410 Equal variances 06. not assumed 31. For the above...
 QUESTION 1 "Look at the SPSS output below. Given a two-tailed test and an alpha of 0.01, what would the appropriate APA-style phrase be?" Independent Samples Test Levene's Test for Equality of Variances t-test for Equality of Means sig Mean Difference Std. Error Difference 95% Confidence Interval of the Mean Lower Upper sig (2-tailed) TAPSPEED 319 582 -2.845 13 .014 -14.00 4.92 -24.63 -3.37 Equal variances assumed Equal variances not assumed -2.927 11.865 013 -14.00 4.78 -24.44 -3.56 O "t...
 QUESTION 12 Using the SPSS output below, which of the following statements is correct? Independent Samples Test Levene's Test for Equality of Variances t-test for Equality of Means 95% Confidence Interval of the Difference Mean F Sig t df Sig. (2- tailed) Std. Error Difference Difference Lower Upper Equal variances assumed 1.429 280 2.145 10 058 6.00000 2.79682 - 23171 12.23171 Equal variances not 2.145 0.461 050 6.00000 2.79082 - 28015 12.28015 assumed The assumption of homogeneity of variance was...
 The output below is for a t-test for the hypothesis: Individuals
living in bad neighborhoods commit more crime than those living in
good neighborhoods. The data in the Group Statistics section
provides you with the average number of crimes committed by
individuals living in good and bad neighborhoods and the standard
deviation of this same variable. The findings of significance are
located in the Independent Samples Test section. Pay particular
attention to the "t" column and the "Sig (2-tailed)"column. The...
The output below is for a t-test for the hypothesis: Individuals
living in bad neighborhoods commit more crime than those living in
good neighborhoods. The data in the Group Statistics section
provides you with the average number of crimes committed by
individuals living in good and bad neighborhoods and the standard
deviation of this same variable. The findings of significance are
located in the Independent Samples Test section. Pay particular
attention to the "t" column and the "Sig (2-tailed)"column. The...
 Do males and females have significant different GPAs? Following is
the output of analysis for 26 males and 25 females.
1. Which of the following statements are true regarding
Levene’s F-test using a .05 level of significance?
a. Means are significantly different
b. Means are not significantly different
c. Variances are significantly different
d.Variances are not significantly different
2. From the chart above, what is the correct t-value, df, and Sig.
used for the t-test:
a. t(49)=0.326, p>0.05
b.t(49)=0.330, p>0.05...
Do males and females have significant different GPAs? Following is
the output of analysis for 26 males and 25 females.
1. Which of the following statements are true regarding
Levene’s F-test using a .05 level of significance?
a. Means are significantly different
b. Means are not significantly different
c. Variances are significantly different
d.Variances are not significantly different
2. From the chart above, what is the correct t-value, df, and Sig.
used for the t-test:
a. t(49)=0.326, p>0.05
b.t(49)=0.330, p>0.05...
 SET Took None Small=0.0001 SUGRY=Hone THREADS AUTO TriBoth DIGITGROUPING NO LEADEROS TABLERENDER=light. T-TEST GROUPS-sex(12) /MISSINGEANALYSIS / VARIABLES-hral CRITERIA CI(.95). T-Test [DataSetl] E:\TEACHING\00304\2012_GSS Data setsav Group Statistics RESPONDENTS SEX MALE Std Dewi NUMBER OF HOURS WORKED LAST WEEK Sid Em N 432 425 Mean 20 35 85 1 FEMALE 4 677 15 216 Independent Samples Test Levene's Test for Equality of Variances est for Equality of Neang Con Derence the Si tie Sidemar Denta NUMBER OF HOURS WORKED LAST WEEK Mean...
Most questions answered within 3 hours.
-
4. Without doing any calculations, predict whether the observed
∆T would increase, decrease or remain the...
asked 54 minutes ago -
Based on the range, which of the following sets of scores has
the greatest variability? 3,...
asked 2 hours ago -
Ripples in a pond travel at a velocity of 3 m/s with one peak
passing a...
asked 1 hour ago -
A man stands on the roof of a building of height 13.0 mm and
throws a...
asked 1 hour ago -
The extent to which assets are financed by borrowed funds and
other liabilities is indicated by:...
asked 2 hours ago -
Explain in detail
Germany is the fifth largest economy
explain what goods and services Germany specializes...
asked 3 hours ago -
The density of platinum is 21.45 g/mL. If a cube of platinum
with a mass of...
asked 3 hours ago -
Accounts Receivable
Sales
A/R Posting
Extended Sales Invoice
Packing Slip
Compare invoice to packing slip 2...
asked 3 hours ago -
Michaella, age 23, is a full-time law student and is claimed by
her parents as a...
asked 3 hours ago -
Why are polymers not typically casted into products?
asked 3 hours ago -
When rolling a die 129 times, what is the probability of rolling
a 6 no more...
asked 3 hours ago -
4. A call option currently sells for $7.75. It has a strike
price of $85 and...
asked 3 hours ago