
Homework Answers
(a)
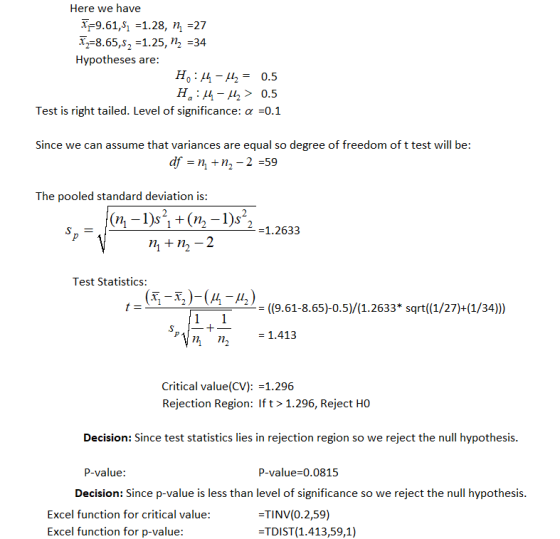
The test statistics is
t = 1.41
The critical value is: 1.30
Since t lies in rejection region, we reject the null hypothesis.
(b)
The p-value is 0.0815
Add Answer to:
The following table shows the average hourly wage rates or day-care centers from two locations based...
Access the hourly wage data on the below Excel Data File (Hourly Wage). An economist wants...
 Access the hourly wage data on the below Excel Data File (Hourly Wage). An economist wants to test if the average hourly wage is less than $27. Assume that the population standard deviation is $5. & Click here for the Excel Data File e. Select the null and the alternative hypotheses for the test. b-1. Find the value of the test statistic. (Negte value should be Indlcated by a minus sign. Round Intermedlate calculetions to at least 4 declmal places...
A union of restaurant and foodservice workers would like to estimate this year's mean hourly wage...
 A union of restaurant and foodservice workers would like to estimate this year's mean hourly wage u for foodservice workers in the U.S. Last year's mean hourly wage was $8.25, and there is reason to believe that this year's value is greater than last year's The union decides to do a statistical test to see if it can be concluded that the mean has increased. The union chooses a random sample of 125 wages from this year Suppose that the...
A union of restaurant and foodservice workers would like to estimate this year's mean hourly wage...
 A union of restaurant and foodservice workers would like to estimate this year's mean hourly wage for foodservice workers in the U.S. Last year's mean hourly wage was 58.14, and there is reason to believe that this year's value is greater than last year's The union decides to do a statistical test to see if it can be concluded that the mean has increased. The union chooses a random sample of 125 wages from this year Suppose that the population...
Consider the following hypothesis statement using alpha equals0.05 and data from two independent samples. Assume the...
Consider the following hypothesis statement using alpha equals0.05 and data from two independent samples. Assume the population variances are equal and the populations are normally distributed. Complete parts a and b. Upper H 0 : mu 1 minus mu 2 equals 0 x overbar 1 equals 14.7 x overbar 2 equals 12.0 Upper H 1 : mu 1 minus mu 2 not equals 0 s 1 equals 2.7 s 2 equals 3.3 n 1 equals 20 n 2 equals 15...
The data to the right show the average retirement ages for a random sample of workers...
 The data to the right show the average retirement ages for a random sample of workers in Country A and a random sample of workers in Country B. Complete parts a and b Country A 65.2 years 30 Country B 66.8 years 30 Sample mean Sample size Population standard deviation 4.5 years 5.1 years a. Perform a hypothesis test using α= 0.05 to determine if the average retirement age in Country B is higher than it is in Country A....
The following table shows age distribution and location of a random sample of 166 buffalo in...
The following table shows age distribution and location of a random sample of 166 buffalo in a national park. Age Lamar District Nez Perce District Firehole District Row Total Calf 13 13 15 41 Yearling 13 11 9 33 Adult 35 28 29 92 Column Total 61 52 53 166 Use a chi-square test to determine if age distribution and location are independent at the 0.05 level of significance. (a) What is the level of significance? State the null and...
A sporting goods store believes the average age of its customers is 38 or less. A...
 A sporting goods store believes the average age of its customers is 38 or less. A random sample of 39 customers years. Using a = 0.01, complete parts a and b below. a. Does the sample provide enough evidence to refute the age claim made by the sporting goods store? Determine the null and alternative hypotheses. Нор Hyu The z-test statistic is (Round to two decimal places as needed.) The critical z-score(s) is(are) (Round to two decimal places as needed....
Suppose a student organization at a university collected data for a study involving class sizes from...
Suppose a student organization at a university collected data for a study involving class sizes from different departments. The following table shows the average class size from a random sample of classes in the business school vs. the average class size from a random sample of classes in the engineering school. Data for the sample sizes and standard deviations are also shown. Use this data to complete parts a through c. Business Engineering Sample mean 38.5 31.2 Sample standard deviation...
A pizza place recently hired additional drivers and as a result now claims that its average...
 A pizza place recently hired additional drivers and as a result now claims that its average delivery time for orders is un minutes. Historically, the standard deviation for delivery time is 11.6 minutes. Using a = 0.01, complete parts a and bb a. Does this sample provide enough evidence to support the delivery time claim made by the pizza place? Determine the null and alternative hypotheses. Ho: H, :μ The Z-test statistic is (Round to two decimal places as needed.)...
The accompanying table gives results from a study of words spoken in a day by men...
 The accompanying table gives results from a study of words spoken in a day by men and women. Assume that both samples are independent simple random samples from populations having normal distributions. Use a 0.05 significance level to test the claim that the numbers of words spoken in a day by men vary more than the numbers of words spoken in a day by women. Men 185 Women 212 15,667.7 6,214.3 8,632.1 7,301.9 What are the null and altenative hypotheses?...
 Access the hourly wage data on the below Excel Data File (Hourly Wage). An economist wants to test if the average hourly wage is less than $27. Assume that the population standard deviation is $5. & Click here for the Excel Data File e. Select the null and the alternative hypotheses for the test. b-1. Find the value of the test statistic. (Negte value should be Indlcated by a minus sign. Round Intermedlate calculetions to at least 4 declmal places...
 A union of restaurant and foodservice workers would like to estimate this year's mean hourly wage u for foodservice workers in the U.S. Last year's mean hourly wage was $8.25, and there is reason to believe that this year's value is greater than last year's The union decides to do a statistical test to see if it can be concluded that the mean has increased. The union chooses a random sample of 125 wages from this year Suppose that the...
 A union of restaurant and foodservice workers would like to estimate this year's mean hourly wage for foodservice workers in the U.S. Last year's mean hourly wage was 58.14, and there is reason to believe that this year's value is greater than last year's The union decides to do a statistical test to see if it can be concluded that the mean has increased. The union chooses a random sample of 125 wages from this year Suppose that the population...
 The data to the right show the average retirement ages for a random sample of workers in Country A and a random sample of workers in Country B. Complete parts a and b Country A 65.2 years 30 Country B 66.8 years 30 Sample mean Sample size Population standard deviation 4.5 years 5.1 years a. Perform a hypothesis test using α= 0.05 to determine if the average retirement age in Country B is higher than it is in Country A....
 A sporting goods store believes the average age of its customers is 38 or less. A random sample of 39 customers years. Using a = 0.01, complete parts a and b below. a. Does the sample provide enough evidence to refute the age claim made by the sporting goods store? Determine the null and alternative hypotheses. Нор Hyu The z-test statistic is (Round to two decimal places as needed.) The critical z-score(s) is(are) (Round to two decimal places as needed....
 A pizza place recently hired additional drivers and as a result now claims that its average delivery time for orders is un minutes. Historically, the standard deviation for delivery time is 11.6 minutes. Using a = 0.01, complete parts a and bb a. Does this sample provide enough evidence to support the delivery time claim made by the pizza place? Determine the null and alternative hypotheses. Ho: H, :μ The Z-test statistic is (Round to two decimal places as needed.)...
 The accompanying table gives results from a study of words spoken in a day by men and women. Assume that both samples are independent simple random samples from populations having normal distributions. Use a 0.05 significance level to test the claim that the numbers of words spoken in a day by men vary more than the numbers of words spoken in a day by women. Men 185 Women 212 15,667.7 6,214.3 8,632.1 7,301.9 What are the null and altenative hypotheses?...
Most questions answered within 3 hours.
-
JAVA
Provide a simple code sample of Merge sort
asked 51 seconds from now -
Discounting cash flows involves:
A. taking the cash discount offered on a trade merchandise
B. estimating...
asked 6 minutes ago -
A solid wood door 1.00 m wide and 2.00 m high is hinged along
one side...
asked 6 minutes ago -
Raleigh Company manufactures two joint products. At the
split-off point, they have sales values of:
Product...
asked 5 minutes ago -
A
projectile is blue at a target. The distance from the point of
impact to the...
asked 7 minutes ago -
1. Your grandmother has invested $4000 in a mutual fund each
year on your birthday (she...
asked 8 minutes ago -
HELP WITH SAS
Run the following DATA step to create a SAS data set called
ABC_CORP....
asked 20 minutes ago -
A researcher wishes to study the cumulative effects of several
combinations of HIV drugs. There are...
asked 40 minutes ago -
How
to make a simple game of whack a mole in pygame
asked 23 minutes ago -
Write a c/c++ program to read a list of students from a file and
create a...
asked 32 minutes ago -
Identify two different methods for collecting data in
qualitative research. What are the benefits and challenges...
asked 33 minutes ago -
I am suppose to have my array before the main class but I am
getting the...
asked 35 minutes ago