NEED ANSWERS FOR ALL THE QUESTIONS PLEASEEEEEEEEE :(:(


Homework Answers
From the graph
1) At price of 100$ the effective quantity is 50 which is point N
2) At this price the demand is falling thus reducing the quantity of angle fishes that are being purchased.
4) price will tend to fall as the quantity of demand is decreased. Thus when demand for any good decrease than price will automatically fall.
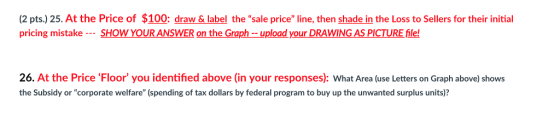
5) The price control is called price ceiling which is made by government where beyond that price the seller cannot sell the product.
13) At price of 60$ the effective quantity is 125 as that is the quantity demanded by the consumer.
14)At this price of 60$ people are demanding more than the price of 100$. Thus if the price is decreasing the demand is increasing.
16) The price will tend to raise as the seller will not be able to get profit if still price goes down.
17)The above Price control made by the government is price floor where it is the lowest legal price that should be paid by consumer. Below that price seller should not sell.
Add Answer to:
NEED ANSWERS FOR ALL THE QUESTIONS PLEASEEEEEEEEE :(:(
Hint: not all Letters on the Graph are...
NEED HELP PLEASE HELP ME !!!! Hint: not all Letters on the Graph are used for...
 NEED HELP PLEASE HELP ME !!!!
Hint: not all Letters on the Graph are used for answers! Yes -Iam trying to trick you. $P IW $100 $70 $60 $40 $20 0 50 75 100 125 160 175 Q Assume: Sellers put the Price for the angelfish, at $100. 1. What is the "effective" Quantity? 2. What is happening, at this Price? 3. How much of one? 4. Will the Price tend to rise or fall? 5. If this price is...
NEED HELP PLEASE HELP ME !!!!
Hint: not all Letters on the Graph are used for answers! Yes -Iam trying to trick you. $P IW $100 $70 $60 $40 $20 0 50 75 100 125 160 175 Q Assume: Sellers put the Price for the angelfish, at $100. 1. What is the "effective" Quantity? 2. What is happening, at this Price? 3. How much of one? 4. Will the Price tend to rise or fall? 5. If this price is...
shortage, Surplus and Gov’t. Price Controls Assume: Sellers put the Price for the angelfish, at...
shortage, Surplus and Gov’t. Price Controls Assume: Sellers put the Price for the angelfish, at $100. What is the “effective” Quantity? What is happening, at this Price? How much of one? Will the Price tend to rise or fall? If this price is imposed by the government (legal force) - what is this type of Price Control called? At the off-equilibrium Price of $100, What Area shows Total Revenue (Total Expenditures)? What Area shows Total Cost (to Seller)? What...
Market Equilibrium & Trade Gains! Use this Market (Supply & Demand) Graph for WingSuits, for...
Market Equilibrium & Trade Gains! Use this Market (Supply & Demand) Graph for WingSuits, for questions 1 - 8: 1. What is the "Equilibrium" (market agreement) Quantity Sold to Buyers? 2. What is the Equilibrium Price? 3. What Area shows Total Revenue (Total Expenditures)? 4. What Area shows Total Cost (to the Seller)? 5. What Area shows Total Maximum Value (to the Buyer)? 6. What Area shows Profit (to Seller)? 7. What Area shows Consumer Surplus (to Buyer)? 8....
NEED HELP WITH THIS PLEASEEEEE Best of Wingsuit Proximit $12,000 $10,000 $8,000 $6,000 $4,000 $2,000| Bu...
 NEED HELP WITH THIS PLEASEEEEE
Best of Wingsuit Proximit $12,000 $10,000 $8,000 $6,000 $4,000 $2,000| Bu 0 10 20 30 40 50 60 70 80 Q Use this Market (Supply & Demand) Graph for WingSuits, for questions 1 - 8: 1. What is the "Equilibrium" (market agreement) Quantity Sold to Buyers? 2. What is the Equilibrium Price? 3. What Area shows Total Revenue (Total Expenditures)? 4. What Area shows Total Cost (to the Seller)? 5. What Area shows Total Maximum...
NEED HELP WITH THIS PLEASEEEEE
Best of Wingsuit Proximit $12,000 $10,000 $8,000 $6,000 $4,000 $2,000| Bu 0 10 20 30 40 50 60 70 80 Q Use this Market (Supply & Demand) Graph for WingSuits, for questions 1 - 8: 1. What is the "Equilibrium" (market agreement) Quantity Sold to Buyers? 2. What is the Equilibrium Price? 3. What Area shows Total Revenue (Total Expenditures)? 4. What Area shows Total Cost (to the Seller)? 5. What Area shows Total Maximum...
Need help please ! Market Table for: DryBar styling appts ar Price: Qd $151,200 $35 1,000...
 Need help please !
Market Table for: DryBar styling appts ar Price: Qd $151,200 $35 1,000 Qs: 500 650 700 750 1,000 1,200 900 750 550 $75 $95 $115400 Using the Table above: 9. What is the Equilibrium (agreement) Quantity sold to buyers in the market? 10. What is the Equilibrium Price in the market? 4 pts) 11. Write a short example showing buyer- seller agreement & market equilibrium: 1st, select a good or a service being traded - then,...
Need help please !
Market Table for: DryBar styling appts ar Price: Qd $151,200 $35 1,000 Qs: 500 650 700 750 1,000 1,200 900 750 550 $75 $95 $115400 Using the Table above: 9. What is the Equilibrium (agreement) Quantity sold to buyers in the market? 10. What is the Equilibrium Price in the market? 4 pts) 11. Write a short example showing buyer- seller agreement & market equilibrium: 1st, select a good or a service being traded - then,...
The following graph shows the supply of (orange curve) and demand for (blue curve) computer keyboards....
 The following graph shows the supply of (orange curve) and demand for (blue curve) computer keyboards. Determine the equililbrium price and quantity of computer keyboards. Based on this, use the green triangle (triangl symbols) to shade the area representing consumer surplus at the equilibrium price. Then use the purple triangle (diamond symbols) to shade the area representing producer surplus at the equilibrium price. PRICE (Dollars per keyboard) 100 Supply CS 80 PS 60 Demand 40 20 50 100 150200 250...
Economics EXERCISE 8.3 MAXIMIZING THE SURPLUS
Consider a market for the tickets to a football match. Six supporters of the Blue team would like to buy tickets; their valuations of a ticket (their WTPwillingness to pay (WTP) An indicator of how much a person values a good, measured by the maximum amount he or she would pay to acquire a unit of the good. See also: willingness to accept.closewillingness to pay (WTP) An indicator of how much a person values a good, measured by the maximum...
NEED HELP WITH THIS ASAP !!!! PLEASEEEEE $700 $600 $500 $400 $300 $200 $100 D, $Value...
 NEED HELP WITH THIS ASAP !!!! PLEASEEEEE
$700 $600 $500 $400 $300 $200 $100 D, $Value 0 10 20 30 40 50 60 70 80 90Qd Use Demand graph above to answer Qns. 1 -4. Assume the $Price for Puppies is$200 1. What is the buyer's optimal (best) quantity demanded, Qd? 2. What Area shows buyer's net gain or 'Consumer Surplus'? 3. What Area shows buyer's Total Dollar Value (Total Willingness to Pay)? 4. What Area shows buyer's Total Expenditures...
NEED HELP WITH THIS ASAP !!!! PLEASEEEEE
$700 $600 $500 $400 $300 $200 $100 D, $Value 0 10 20 30 40 50 60 70 80 90Qd Use Demand graph above to answer Qns. 1 -4. Assume the $Price for Puppies is$200 1. What is the buyer's optimal (best) quantity demanded, Qd? 2. What Area shows buyer's net gain or 'Consumer Surplus'? 3. What Area shows buyer's Total Dollar Value (Total Willingness to Pay)? 4. What Area shows buyer's Total Expenditures...
Part 1. What was the equilibrium price in this market before the tax? What is the amount of the tax? How much of the t...
 Part 1.
What was the equilibrium price in this market before the
tax?
What is the amount of the tax?
How much of the tax will the buyers pay?
How much of the tax will the sellers pay?
How much will the buyer pay for the product after the tax is
imposed?
How much will the seller receive after the tax is imposed?
As a result of the tax, what has happened to the level of
output?
Calculate the economic...
Part 1.
What was the equilibrium price in this market before the
tax?
What is the amount of the tax?
How much of the tax will the buyers pay?
How much of the tax will the sellers pay?
How much will the buyer pay for the product after the tax is
imposed?
How much will the seller receive after the tax is imposed?
As a result of the tax, what has happened to the level of
output?
Calculate the economic...
 NEED HELP PLEASE HELP ME !!!!
Hint: not all Letters on the Graph are used for answers! Yes -Iam trying to trick you. $P IW $100 $70 $60 $40 $20 0 50 75 100 125 160 175 Q Assume: Sellers put the Price for the angelfish, at $100. 1. What is the "effective" Quantity? 2. What is happening, at this Price? 3. How much of one? 4. Will the Price tend to rise or fall? 5. If this price is...
NEED HELP PLEASE HELP ME !!!!
Hint: not all Letters on the Graph are used for answers! Yes -Iam trying to trick you. $P IW $100 $70 $60 $40 $20 0 50 75 100 125 160 175 Q Assume: Sellers put the Price for the angelfish, at $100. 1. What is the "effective" Quantity? 2. What is happening, at this Price? 3. How much of one? 4. Will the Price tend to rise or fall? 5. If this price is...
 NEED HELP WITH THIS PLEASEEEEE
Best of Wingsuit Proximit $12,000 $10,000 $8,000 $6,000 $4,000 $2,000| Bu 0 10 20 30 40 50 60 70 80 Q Use this Market (Supply & Demand) Graph for WingSuits, for questions 1 - 8: 1. What is the "Equilibrium" (market agreement) Quantity Sold to Buyers? 2. What is the Equilibrium Price? 3. What Area shows Total Revenue (Total Expenditures)? 4. What Area shows Total Cost (to the Seller)? 5. What Area shows Total Maximum...
NEED HELP WITH THIS PLEASEEEEE
Best of Wingsuit Proximit $12,000 $10,000 $8,000 $6,000 $4,000 $2,000| Bu 0 10 20 30 40 50 60 70 80 Q Use this Market (Supply & Demand) Graph for WingSuits, for questions 1 - 8: 1. What is the "Equilibrium" (market agreement) Quantity Sold to Buyers? 2. What is the Equilibrium Price? 3. What Area shows Total Revenue (Total Expenditures)? 4. What Area shows Total Cost (to the Seller)? 5. What Area shows Total Maximum...
 Need help please !
Market Table for: DryBar styling appts ar Price: Qd $151,200 $35 1,000 Qs: 500 650 700 750 1,000 1,200 900 750 550 $75 $95 $115400 Using the Table above: 9. What is the Equilibrium (agreement) Quantity sold to buyers in the market? 10. What is the Equilibrium Price in the market? 4 pts) 11. Write a short example showing buyer- seller agreement & market equilibrium: 1st, select a good or a service being traded - then,...
Need help please !
Market Table for: DryBar styling appts ar Price: Qd $151,200 $35 1,000 Qs: 500 650 700 750 1,000 1,200 900 750 550 $75 $95 $115400 Using the Table above: 9. What is the Equilibrium (agreement) Quantity sold to buyers in the market? 10. What is the Equilibrium Price in the market? 4 pts) 11. Write a short example showing buyer- seller agreement & market equilibrium: 1st, select a good or a service being traded - then,...
 The following graph shows the supply of (orange curve) and demand for (blue curve) computer keyboards. Determine the equililbrium price and quantity of computer keyboards. Based on this, use the green triangle (triangl symbols) to shade the area representing consumer surplus at the equilibrium price. Then use the purple triangle (diamond symbols) to shade the area representing producer surplus at the equilibrium price. PRICE (Dollars per keyboard) 100 Supply CS 80 PS 60 Demand 40 20 50 100 150200 250...
 NEED HELP WITH THIS ASAP !!!! PLEASEEEEE
$700 $600 $500 $400 $300 $200 $100 D, $Value 0 10 20 30 40 50 60 70 80 90Qd Use Demand graph above to answer Qns. 1 -4. Assume the $Price for Puppies is$200 1. What is the buyer's optimal (best) quantity demanded, Qd? 2. What Area shows buyer's net gain or 'Consumer Surplus'? 3. What Area shows buyer's Total Dollar Value (Total Willingness to Pay)? 4. What Area shows buyer's Total Expenditures...
NEED HELP WITH THIS ASAP !!!! PLEASEEEEE
$700 $600 $500 $400 $300 $200 $100 D, $Value 0 10 20 30 40 50 60 70 80 90Qd Use Demand graph above to answer Qns. 1 -4. Assume the $Price for Puppies is$200 1. What is the buyer's optimal (best) quantity demanded, Qd? 2. What Area shows buyer's net gain or 'Consumer Surplus'? 3. What Area shows buyer's Total Dollar Value (Total Willingness to Pay)? 4. What Area shows buyer's Total Expenditures...
 Part 1.
What was the equilibrium price in this market before the
tax?
What is the amount of the tax?
How much of the tax will the buyers pay?
How much of the tax will the sellers pay?
How much will the buyer pay for the product after the tax is
imposed?
How much will the seller receive after the tax is imposed?
As a result of the tax, what has happened to the level of
output?
Calculate the economic...
Part 1.
What was the equilibrium price in this market before the
tax?
What is the amount of the tax?
How much of the tax will the buyers pay?
How much of the tax will the sellers pay?
How much will the buyer pay for the product after the tax is
imposed?
How much will the seller receive after the tax is imposed?
As a result of the tax, what has happened to the level of
output?
Calculate the economic...
Most questions answered within 3 hours.
-
For the reaction CaI2+2AgNO3⟶2AgI+Ca(NO3)2 how many grams of
silver iodide, AgI, are produced from 56.5 g...
asked 6 minutes ago -
Write an equation for hydrolysis via acid catalysis.
Using ethyl acetate, ethyl benzoate, ethyl formate or...
asked 14 minutes ago -
Only one graph is needed.
(a) Draw a Supply Curve and the Demand Curve for the...
asked 17 minutes ago -
Fill in the blanks and please show how you arrived at numerical
answers
. The...
asked 17 minutes ago -
91. If the half – life of a sample of radioactive
material is 60 days, what...
asked 24 minutes ago -
White light (380nm-750nm) strikes a diffraction grating (420
lines/mm) at normal incidence. What is the highest-order...
asked 34 minutes ago -
1) Explain what is meant by a good being "excludable."?
2) Explain what is meant by...
asked 33 minutes ago -
I need help with this question:
Describe in detail at least two factors that stimulated American...
asked 40 minutes ago -
Calculate the Boyle temperature for helium assuming it follows
the Berthelot equation of state.
asked 41 minutes ago -
Summarize Strategic Corporate Social Responsibility, 4th edition
2017 book, chapter one and two.
asked 41 minutes ago -
1. If the standard deviations for return on stock A and stock B
are 28% and...
asked 56 minutes ago -
Please use python to explain.
Assume that the variables x and
y refer to strings. Write...
asked 1 hour ago