NEED HELP WITH THIS ASAP !!!! PLEASEEEEE

Homework Answers
1) 80 units
2) C.S = 1/2 x base x height = 1/2 x 80 x (700 - 200) = 40 x 500 = 20,000
3) Blue dotted area shows buyer's total dollar value.
4) Red dotted area shows buyer's total expenditure.
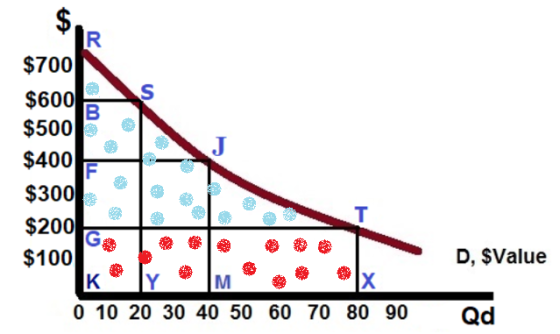
5. Consumer surplus = Price consumer is willing to pay - Actual price of good = 650 - 530 = $ 120
Add Answer to:
NEED HELP WITH THIS ASAP !!!! PLEASEEEEE
$700 $600 $500 $400 $300 $200 $100 D, $Value...
Demand Curve & Consumer Surplus. Assume the $Price for Puppies is $200. 1. What is the...
Demand Curve & Consumer Surplus. Assume the $Price for Puppies is $200. 1. What is the buyer’s optimal (best) quantity demanded, Qd? 2. What Area shows buyer’s net gain or ‘Consumer Surplus’? 3. What Area shows buyer’s Total Dollar Value (Total Willingness to Pay)? 4. What Area shows buyer’s Total Expenditures (spending on good)? 5. Number example of Consumer Surplus: Lara wants to buy a new Surf board. She is willing to spend $650 maximum. The Price of one she...
NEED HELP WITH THIS ASAP !!!! PLEASEEEEE Supply Curve & Producer Surplus (Profit). YS, $Cost $350...
 NEED HELP WITH THIS ASAP !!!! PLEASEEEEE
Supply Curve & Producer Surplus (Profit). YS, $Cost $350 $250I $150 K M 0 2 4 6 8 10 12 14 16 18 Qs Use Supply (cost) curve graph above to answer Questions 1-4. Assume Price of Good is selling at: $350 each. 1. What is the seller's optimal (best) quantity supplied, Qs? 2. What Area shows his net gain or Profit (Producer Surplus)? 3. What Area shows Total Revenue (P. x Q....
NEED HELP WITH THIS ASAP !!!! PLEASEEEEE
Supply Curve & Producer Surplus (Profit). YS, $Cost $350 $250I $150 K M 0 2 4 6 8 10 12 14 16 18 Qs Use Supply (cost) curve graph above to answer Questions 1-4. Assume Price of Good is selling at: $350 each. 1. What is the seller's optimal (best) quantity supplied, Qs? 2. What Area shows his net gain or Profit (Producer Surplus)? 3. What Area shows Total Revenue (P. x Q....
NEED HELP WITH THIS PLEASEEEEE Best of Wingsuit Proximit $12,000 $10,000 $8,000 $6,000 $4,000 $2,000| Bu...
 NEED HELP WITH THIS PLEASEEEEE
Best of Wingsuit Proximit $12,000 $10,000 $8,000 $6,000 $4,000 $2,000| Bu 0 10 20 30 40 50 60 70 80 Q Use this Market (Supply & Demand) Graph for WingSuits, for questions 1 - 8: 1. What is the "Equilibrium" (market agreement) Quantity Sold to Buyers? 2. What is the Equilibrium Price? 3. What Area shows Total Revenue (Total Expenditures)? 4. What Area shows Total Cost (to the Seller)? 5. What Area shows Total Maximum...
NEED HELP WITH THIS PLEASEEEEE
Best of Wingsuit Proximit $12,000 $10,000 $8,000 $6,000 $4,000 $2,000| Bu 0 10 20 30 40 50 60 70 80 Q Use this Market (Supply & Demand) Graph for WingSuits, for questions 1 - 8: 1. What is the "Equilibrium" (market agreement) Quantity Sold to Buyers? 2. What is the Equilibrium Price? 3. What Area shows Total Revenue (Total Expenditures)? 4. What Area shows Total Cost (to the Seller)? 5. What Area shows Total Maximum...
3. Consumer surplus and price changes Aa Aa . The following graph shows the demand curve...
 3. Consumer surplus and price changes Aa Aa . The following graph shows the demand curve for a group of consumers in the market for a mobile phone. Each consumer wants only one mobile phone. Assume that if an individual has a willingness to pay just equal to the market price, he or she will make the purchase. (Notice that on this graph, the demand curve is drawn as a series o steps, but only the rightmost corner of each...
Part 3: Quotas Table: Market for Houses P QD QS $100 1300 100 $200 1100 300...
Part 3: Quotas Table: Market for Houses P QD QS $100 1300 100 $200 1100 300 $300 900 500 $400 700 700 $500 500 900 $600 300 1100 $700 100 1300 Notes: P = Price in thousands of $ QD = quantity demanded in thousands of homes QS = quantity supplied in thousands of homes Suppose the government implements new zoning regulations that allow a maximum of 300,000 new homes to be constructed. At the quota limit, what is the...
I really need help with the various parts of this one question. Consider the Panamanian market...
 I really need help with the various parts of this one
question.
Consider the Panamanian market for tangerines The following graph shows the domestic demand and domestic supply curves for tangerines in Panama. Suppose Panama's government currently does not allow the international trade of tangerines. Using the black point (X symbol), indicate the equillbrium price of a ton of tangerines and the equilibrium quantity of tangerlines in Panama in the absence of international trade. Dashed drop lines will automatically extend...
I really need help with the various parts of this one
question.
Consider the Panamanian market for tangerines The following graph shows the domestic demand and domestic supply curves for tangerines in Panama. Suppose Panama's government currently does not allow the international trade of tangerines. Using the black point (X symbol), indicate the equillbrium price of a ton of tangerines and the equilibrium quantity of tangerlines in Panama in the absence of international trade. Dashed drop lines will automatically extend...
Variable Cost (dollars) $0 Quantity O 100 200 300 400 500 600 Total Cost (dollars) $1,000 1,360 1,560 1,960 2,760 4,000...
 Variable Cost (dollars) $0 Quantity O 100 200 300 400 500 600 Total Cost (dollars) $1,000 1,360 1,560 1,960 2,760 4,000 5,800 360 560 960 1,760 3.000 4.800 Table 10.1 shows the short-run cost data of a perfectly competitive firm that produces plastic camera cases. Assume that output can only be increased in batches of 100 units. Refer to Table 10.1. If the market price of each camera case is $8, what is the profit- maximizing quantity?
ΤΕΧΝΙΤΗΤΗ iple Choice y the choice that best completes the statement or answers the question. The...
 ΤΕΧΝΙΤΗΤΗ iple Choice y the choice that best completes the statement or answers the question. The production possibilities frontier is a graph that shows the various combinations of output that an economy a. should produce. b. wants to produce. c. can produce d. demands 2 The price index was 320 in one year and 360 in the next year. What was the inflation rate? a. 9 percent ((B-A)/A)*100 b. 11.1 percent c. 12.5 percent ((360 - 320)/320)*100 d. 40 percent...
 NEED HELP WITH THIS ASAP !!!! PLEASEEEEE
Supply Curve & Producer Surplus (Profit). YS, $Cost $350 $250I $150 K M 0 2 4 6 8 10 12 14 16 18 Qs Use Supply (cost) curve graph above to answer Questions 1-4. Assume Price of Good is selling at: $350 each. 1. What is the seller's optimal (best) quantity supplied, Qs? 2. What Area shows his net gain or Profit (Producer Surplus)? 3. What Area shows Total Revenue (P. x Q....
NEED HELP WITH THIS ASAP !!!! PLEASEEEEE
Supply Curve & Producer Surplus (Profit). YS, $Cost $350 $250I $150 K M 0 2 4 6 8 10 12 14 16 18 Qs Use Supply (cost) curve graph above to answer Questions 1-4. Assume Price of Good is selling at: $350 each. 1. What is the seller's optimal (best) quantity supplied, Qs? 2. What Area shows his net gain or Profit (Producer Surplus)? 3. What Area shows Total Revenue (P. x Q....
 NEED HELP WITH THIS PLEASEEEEE
Best of Wingsuit Proximit $12,000 $10,000 $8,000 $6,000 $4,000 $2,000| Bu 0 10 20 30 40 50 60 70 80 Q Use this Market (Supply & Demand) Graph for WingSuits, for questions 1 - 8: 1. What is the "Equilibrium" (market agreement) Quantity Sold to Buyers? 2. What is the Equilibrium Price? 3. What Area shows Total Revenue (Total Expenditures)? 4. What Area shows Total Cost (to the Seller)? 5. What Area shows Total Maximum...
NEED HELP WITH THIS PLEASEEEEE
Best of Wingsuit Proximit $12,000 $10,000 $8,000 $6,000 $4,000 $2,000| Bu 0 10 20 30 40 50 60 70 80 Q Use this Market (Supply & Demand) Graph for WingSuits, for questions 1 - 8: 1. What is the "Equilibrium" (market agreement) Quantity Sold to Buyers? 2. What is the Equilibrium Price? 3. What Area shows Total Revenue (Total Expenditures)? 4. What Area shows Total Cost (to the Seller)? 5. What Area shows Total Maximum...
 3. Consumer surplus and price changes Aa Aa . The following graph shows the demand curve for a group of consumers in the market for a mobile phone. Each consumer wants only one mobile phone. Assume that if an individual has a willingness to pay just equal to the market price, he or she will make the purchase. (Notice that on this graph, the demand curve is drawn as a series o steps, but only the rightmost corner of each...
 I really need help with the various parts of this one
question.
Consider the Panamanian market for tangerines The following graph shows the domestic demand and domestic supply curves for tangerines in Panama. Suppose Panama's government currently does not allow the international trade of tangerines. Using the black point (X symbol), indicate the equillbrium price of a ton of tangerines and the equilibrium quantity of tangerlines in Panama in the absence of international trade. Dashed drop lines will automatically extend...
I really need help with the various parts of this one
question.
Consider the Panamanian market for tangerines The following graph shows the domestic demand and domestic supply curves for tangerines in Panama. Suppose Panama's government currently does not allow the international trade of tangerines. Using the black point (X symbol), indicate the equillbrium price of a ton of tangerines and the equilibrium quantity of tangerlines in Panama in the absence of international trade. Dashed drop lines will automatically extend...
 Variable Cost (dollars) $0 Quantity O 100 200 300 400 500 600 Total Cost (dollars) $1,000 1,360 1,560 1,960 2,760 4,000 5,800 360 560 960 1,760 3.000 4.800 Table 10.1 shows the short-run cost data of a perfectly competitive firm that produces plastic camera cases. Assume that output can only be increased in batches of 100 units. Refer to Table 10.1. If the market price of each camera case is $8, what is the profit- maximizing quantity?
 ΤΕΧΝΙΤΗΤΗ iple Choice y the choice that best completes the statement or answers the question. The production possibilities frontier is a graph that shows the various combinations of output that an economy a. should produce. b. wants to produce. c. can produce d. demands 2 The price index was 320 in one year and 360 in the next year. What was the inflation rate? a. 9 percent ((B-A)/A)*100 b. 11.1 percent c. 12.5 percent ((360 - 320)/320)*100 d. 40 percent...
Most questions answered within 3 hours.
-
How many coulombs are required to plate a layer of chromium
metal 0.27 mm thick on...
asked 2 minutes ago -
A box slides from rest down an inclined place that is 30 degrees
above the horizontal...
asked 4 minutes ago -
Determine the amount of excess reactant that remains after 50.0
g N2O4 and 45.0 g N2H4...
asked 6 minutes ago -
The number of calls coming into a hotel’s reservation during any
fixed timeinterval will follow a...
asked 8 minutes ago -
Suppose that you are the experimenter of a project running
several sections of both the experimental...
asked 12 minutes ago -
The main differences between mid-latitude cyclones and tropical
cyclones (at least six sentences long).
asked 11 minutes ago -
Prove that each of the problems below is in the NP class.
4-SAT problem
Instance: A...
asked 13 minutes ago -
Health care Field.
Employers often define metrics to measure productivity or
effectiveness in the workplace. Examples...
asked 20 minutes ago -
2. What is the "great turnaround" with respect to offshore
labor?
asked 32 minutes ago -
Frost wedging breaks apart a large rock measuring 12 m
long by 12 m wide by...
asked 25 minutes ago -
Consider an 8 to 256 decoder built using 256 8-input AND
gates.
1. For the decimal...
asked 30 minutes ago -
A 0.510 m0.510 m aqueous solution of KBrKBr has a total mass of
71.0 g.71.0 g....
asked 35 minutes ago