


million. (Hint: Mouse over any area you shaded to Based on the prior graph, total welfare in the absence of intenational trade is display its value in thousands of dollars.) The following graph again shows the domestic demand and domestic supply curves for tangerines in Panama. Suppose that the Panamanian government changes its international trade policy and Panama now allows free trade in tangerines. The world price of tangerines is $120 per ton, as shown by the horizontal dashed line. Assume that Panama's entry into the world market for tangerines has no effect on the world price and there are no transportation or transaction costs associated with international trade in tangerines. Also assume that domestic suppliers will satisty domestic demand as much as possible before any exporting or importing takes place. PRICE IDollars per tonl 440 Domestic Supply Domestic Demand 400 360 PS 320 280 240 200 World Price 160 120 80 500 0 300 200 100 Help Clear Al QUANTITY Thousands of tons of tangerines edd.comTh When free trade in tangerines is allowed, the price of a ton of tangerines in Panama will be tangerines will be demanded in Panama, and At this price, Trending on r/aw have t deovered the tons will be supplied by domestic suppliers Therefore, Panama v tons of tangerines
At this price, tons of When free trade in tangerines is allowed, the price of a ton of tangerines in Panama will be tangerines will be demanded in Panama, and tons of tangerines. tons will be supplied by domestic suppliers. Therefore, Panama will import On the second graph showing the world price of tangerines, use the green (triangle symbols) and purple (diamond symbols) triangles once again to show the consumer and producer surplus once Panama allows free trade in tangerines. Then, compare both graphs to complete the following table and analyze the welfare effects of allowing free trade. Before Trade After Trade (Millions of $) (Millions of $) Consumer Surplus Producer Surplus million, and producer surplus million. by When Panama allows free trade, the country's consumer surplus of million. So the net effect of international trade on Panama's total welfare is a by
Homework Answers
Consumer surplus is the area below demand curve and above equilibrium price.
Producer surplus is the area above demand curve and below equilibrium price.
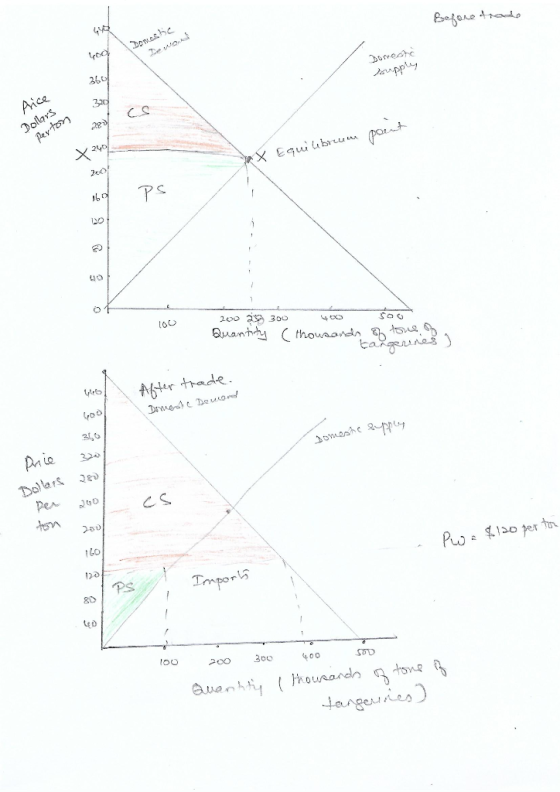
Before trade
The equilibrium price where domestic demand equals domestic supply is $240 per pound. The equilibrium quantity is 250,000 tons.
Consumer surplus
Area of triangle = ½ x base x height
= ½ x (250-0) x (440-240)
=1/2 x 250 x 200= 1/2 x 50,000= $25,000.
Producer surplus
Area of triangle = ½ x base x height
= ½ x (250-0) x (240-0)
=1/2 x 250 x 240= 1/2 x 60,000= $30,000.
Total surplus= Consumer surplus + Producer surplus
= $25,000 + $30,000= $55,000.
After trade
Quantity supplied= 100 tons
Quantity demanded= 400 tons
Imports is quantity demanded – quantity supplied=300 tons
Consumer surplus
Area of triangle = ½ x base x height
= ½ x (400-0) x (440-120)
=1/2 x 400 x 320= 1/2 x 128,000= $64,000.
Producer surplus
Area of triangle = ½ x base x height
= ½ x (100-0) x (120-40)
=1/2 x 100 x 80= 1/2 x 8,000= $4,000.
Total surplus= Consumer surplus + Producer surplus
= $64,000 + $4,000= $68,000.
|
With Free trade ($) |
Without free trade ($) |
|
|
Consumer surplus |
$64,000 |
$25,000 |
|
Producer surplus |
$4,000 |
$30,000 |
With free trade, consumer surplus increases by $64,000 - $25,000= $39,000. Producer surplus decreases by $30,000 - $4000=$26,000.
Add Answer to:
I really need help with the various parts of this one
question.
Consider the Panamanian market...
The following graph shows the domestic demand and domestic supply curves for tangerines in Panama. Suppose...
 The following graph shows the domestic demand and domestic supply curves for tangerines in Panama. Suppose Panama's government currently does not allow international trade in tangerines. Use the black point (plus symbol) to indicate the equilibrium price of a ton of tangerines and the equilibrium quantity of tangerines in Panama in the absence of international trade. Then, use the green triangle (triangle symbol) to shade the area representing consumer surplus in equilibrium. Finally, use the purple triangle (diamond symbol) to...
Consider the Sudanese market for tangerines The following graph shows the domestic demand and domestic supply...
 Consider the Sudanese market for tangerines The following graph shows the domestic demand and domestic supply curves for tangerines in Sudan. Suppose Sudan's government currently does not allow international trade in tangerines Use the black point (plus symbol) to indicate the equilibrium price of a ton of tangerines and the equilibrium quantity of tangerines in Sudan in the absence of international trade. Then, use the green triangle (triangle symbol) to shade the area representing consumer surplus in equilibrium. Finally, use...
fill in the blanks 1)increase/decrease 2)increase/decrease 3)gain/loss Consider the Sudanese market for tangerines. The...
 fill in the blanks
1)increase/decrease
2)increase/decrease
3)gain/loss
Consider the Sudanese market for tangerines. The following graph shows the domestic demand and domestic supply curves for tangerines in Sudan. Suppose Sudan's government currently does not allow international trade in tangerines. Use the black point (plus symbol) to indicate the equilibrium price of a ton of tangerines and the equilibrium quantity of tangerines in Sudan in the absence of international trade. Then, use the green triangle (triangle symbol) to shade the area...
fill in the blanks
1)increase/decrease
2)increase/decrease
3)gain/loss
Consider the Sudanese market for tangerines. The following graph shows the domestic demand and domestic supply curves for tangerines in Sudan. Suppose Sudan's government currently does not allow international trade in tangerines. Use the black point (plus symbol) to indicate the equilibrium price of a ton of tangerines and the equilibrium quantity of tangerines in Sudan in the absence of international trade. Then, use the green triangle (triangle symbol) to shade the area...
Consider the Guatemalan market for tangerines. The following graph shows the domestic demand and domestic supply...
 Consider the Guatemalan market for tangerines. The following graph shows the domestic demand and domestic supply curves for tangerines in Guatemala. Suppose Guatemala's government currently does not allow international trade in tangerines Use the black point (plus symbol) to indicate the equilibrium price of a ton of tangerines and the equilibrium quantity of tangerines in Guatemala in the absence of international trade. Then, use the green triangle (triangle symbol) to shade the area representing consumer surplus in equilibrium. Finally, use...
Suppose Panama is open to free trade in the world market for maize. Because of Panama's small size, the demand for and supply of maize in Panama do not affect the world price.
 6. Welfare effects of a tariff in a small country Suppose Panama is open to free trade in the world market for maize. Because of Panama's small size, the demand for and supply of maize in Panama do not affect the world price. The following graph shows the domestic maize market in Panama. The world price of maize is Pw =$350 per ton. On the following graph, use the green triangle (triangle symbols) to shade the area representing consumer surplus (CS) when...
Consider the Colombian market for soybeans. The following graph shows the domestic demand and domestic supply...
 Consider the Colombian market for soybeans. The following graph shows the domestic demand and domestic supply curves for soybeans in Colombia. Suppose Colombia's government currently does not allow international trade in soybeans. Use the black point (plus symbol) to indicate the equilibrium price of a ton of soybeans and the equilibrium quantity of soybeans in Colombia in the absence of international trade. Then, use the green triangle (triangle symbol) to shade the area representing consumer surplus in equilibrium. Finally, use the purple...
Consider the Bolivian market for lemons. The following graph shows the domestic demand and domestic supply...
 Consider the Bolivian market for lemons. The following graph shows the domestic demand and domestic supply curves for lemons in Bolivia. Suppose Bolivia's government currently does not allow international trade in lemons. Use the black point (plus symbol) to indicate the equilibrium price of a ton of lemons and the equilibrium quantity of lemons in Bolivia in the absence of international trade. Then, use the green triangle (triangle symbol) to shade the area representing consumer surplus in equilibrium. Finally, use...
Consider the Colombian market for soybeans. The following graph shows the domestic demand and domestic supply...
 Consider the Colombian market for soybeans. The following graph shows the domestic demand and domestic supply curves for soybeans in Colombia. Suppose Colombia's government currently does not allow international trade in soybeans. Use the black point (plus symbol) to indicate the equilibrium price of a ton of soybeans and the equilibrium quantity of soybeans in Colombia in the absence of international trade. Then, use the green triangle (triangle symbol) to shade the area representing consumer surplus in equilibrium. Finally, use...
3. Consumer Surplus and Producer Surplus from Market Exchange Consider the Zambian market for ora...
 3. Consumer Surplus and Producer Surplus from Market
Exchange
Consider the Zambian market for oranges.
The following graph shows the domestic demand and domestic
supply curves for oranges in Zambia. Suppose Zambia's government
currently does not allow the international trade in oranges.
Use the black point (plus symbol) to indicate the equilibrium
price of a ton of oranges and the equilibrium quantity of oranges
in Zambia in the absence of international trade. Then, use the
green point (triangle symbol) to...
3. Consumer Surplus and Producer Surplus from Market
Exchange
Consider the Zambian market for oranges.
The following graph shows the domestic demand and domestic
supply curves for oranges in Zambia. Suppose Zambia's government
currently does not allow the international trade in oranges.
Use the black point (plus symbol) to indicate the equilibrium
price of a ton of oranges and the equilibrium quantity of oranges
in Zambia in the absence of international trade. Then, use the
green point (triangle symbol) to...
Suppose Sudan is a "small country" In the world market for corn. The following graph shows the demand and supply curves for the domestic market for com. The world price is $125 per ton...
 Suppose Sudan is a "small country" In the world market for corn. The following graph shows the demand and supply curves for the domestic market for com. The world price is $125 per ton of corn. Throughout the question, assume that changes in trade polkdles in other countries do not significantly affect the world market for corn and that there are no transportation or transaction costs assoclated with international trade in corn. Also assume that domestic suppliers will satisty domestic...
 The following graph shows the domestic demand and domestic supply curves for tangerines in Panama. Suppose Panama's government currently does not allow international trade in tangerines. Use the black point (plus symbol) to indicate the equilibrium price of a ton of tangerines and the equilibrium quantity of tangerines in Panama in the absence of international trade. Then, use the green triangle (triangle symbol) to shade the area representing consumer surplus in equilibrium. Finally, use the purple triangle (diamond symbol) to...
 Consider the Sudanese market for tangerines The following graph shows the domestic demand and domestic supply curves for tangerines in Sudan. Suppose Sudan's government currently does not allow international trade in tangerines Use the black point (plus symbol) to indicate the equilibrium price of a ton of tangerines and the equilibrium quantity of tangerines in Sudan in the absence of international trade. Then, use the green triangle (triangle symbol) to shade the area representing consumer surplus in equilibrium. Finally, use...
 fill in the blanks
1)increase/decrease
2)increase/decrease
3)gain/loss
Consider the Sudanese market for tangerines. The following graph shows the domestic demand and domestic supply curves for tangerines in Sudan. Suppose Sudan's government currently does not allow international trade in tangerines. Use the black point (plus symbol) to indicate the equilibrium price of a ton of tangerines and the equilibrium quantity of tangerines in Sudan in the absence of international trade. Then, use the green triangle (triangle symbol) to shade the area...
fill in the blanks
1)increase/decrease
2)increase/decrease
3)gain/loss
Consider the Sudanese market for tangerines. The following graph shows the domestic demand and domestic supply curves for tangerines in Sudan. Suppose Sudan's government currently does not allow international trade in tangerines. Use the black point (plus symbol) to indicate the equilibrium price of a ton of tangerines and the equilibrium quantity of tangerines in Sudan in the absence of international trade. Then, use the green triangle (triangle symbol) to shade the area...
 Consider the Guatemalan market for tangerines. The following graph shows the domestic demand and domestic supply curves for tangerines in Guatemala. Suppose Guatemala's government currently does not allow international trade in tangerines Use the black point (plus symbol) to indicate the equilibrium price of a ton of tangerines and the equilibrium quantity of tangerines in Guatemala in the absence of international trade. Then, use the green triangle (triangle symbol) to shade the area representing consumer surplus in equilibrium. Finally, use...
 Consider the Bolivian market for lemons. The following graph shows the domestic demand and domestic supply curves for lemons in Bolivia. Suppose Bolivia's government currently does not allow international trade in lemons. Use the black point (plus symbol) to indicate the equilibrium price of a ton of lemons and the equilibrium quantity of lemons in Bolivia in the absence of international trade. Then, use the green triangle (triangle symbol) to shade the area representing consumer surplus in equilibrium. Finally, use...
 Consider the Colombian market for soybeans. The following graph shows the domestic demand and domestic supply curves for soybeans in Colombia. Suppose Colombia's government currently does not allow international trade in soybeans. Use the black point (plus symbol) to indicate the equilibrium price of a ton of soybeans and the equilibrium quantity of soybeans in Colombia in the absence of international trade. Then, use the green triangle (triangle symbol) to shade the area representing consumer surplus in equilibrium. Finally, use...
 3. Consumer Surplus and Producer Surplus from Market
Exchange
Consider the Zambian market for oranges.
The following graph shows the domestic demand and domestic
supply curves for oranges in Zambia. Suppose Zambia's government
currently does not allow the international trade in oranges.
Use the black point (plus symbol) to indicate the equilibrium
price of a ton of oranges and the equilibrium quantity of oranges
in Zambia in the absence of international trade. Then, use the
green point (triangle symbol) to...
3. Consumer Surplus and Producer Surplus from Market
Exchange
Consider the Zambian market for oranges.
The following graph shows the domestic demand and domestic
supply curves for oranges in Zambia. Suppose Zambia's government
currently does not allow the international trade in oranges.
Use the black point (plus symbol) to indicate the equilibrium
price of a ton of oranges and the equilibrium quantity of oranges
in Zambia in the absence of international trade. Then, use the
green point (triangle symbol) to...
 Suppose Sudan is a "small country" In the world market for corn. The following graph shows the demand and supply curves for the domestic market for com. The world price is $125 per ton of corn. Throughout the question, assume that changes in trade polkdles in other countries do not significantly affect the world market for corn and that there are no transportation or transaction costs assoclated with international trade in corn. Also assume that domestic suppliers will satisty domestic...
Most questions answered within 3 hours.
-
2. (1.5pt) Calculate [ClO-] in a 6.00% bleach solution. A 6.00%
bleach solution contains 6.00g of...
asked 20 minutes ago -
Protons in cosmic rays have been observed with kinetic energies
as large as 1.0×10²⁰eV.
How fast...
asked 1 hour ago -
How do you explain that it is not fair for teachers to verbally
abuse you over...
asked 1 hour ago -
Ang Electronics, Inc., has developed a new HD DVD. If the HD DVD
is successful, the...
asked 2 hours ago -
which of these substances cannot behave as a lewis base in an aq
solution
a- Co...
asked 2 hours ago -
Below are some of Toyota’s (an automotive manufacturer) costs to
manufacture a car: I. Depreciation of...
asked 2 hours ago -
A random sample of 40 cups of coffee from a vending machine had
a sample mean...
asked 2 hours ago -
The mercury in a fish sample is determined to be 1.80, 1.58 and
1.64 ppm. Calculate...
asked 2 hours ago -
Suppose a photon is equally likely to be found anywhere in an
interval of 28.5 cm...
asked 2 hours ago -
Suppose the following is a divide-and-conquer algorithm for some
problem.
"Make the input of size n...
asked 2 hours ago -
Calculate the pH of the resulting solution if 15.0 mL of 0.150 M
HCl(aq) is added...
asked 3 hours ago -
How many moles of sulphur hexaflouride are present in 3.64 x 10^21
molecules of this compound?
asked 3 hours ago