


Homework Answers

Based on previous graph,total surplus in the absence of international trade is = [0.5x410-335x100]+[0.5x335-260x100] = 3750+3750 = 7500
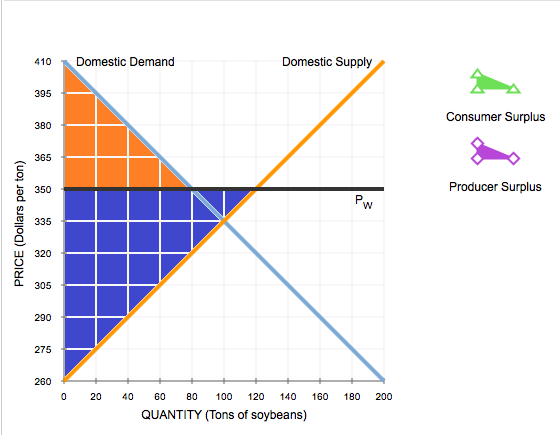
When columbia allows free trade of soybeans,the price is 350.At this price 80 tons will be demanded and 120 tons will be supplied.Therefore Columbia will export 120-80 = 40 tons
CS without free trade = 3750
CS with free trade = 0.5x410-350x80 = 2400
PS without free trade = 3750
PS with free trade = 0.5x350-260x120 = 5400
When Columbia allows free trade,the country's CS decreases by 3750-2400 = 1350 and PS increases by 5400-3750 = 1650 so the net effect of international trade on Columbia's total surplus is a gain of 1650-1350 = 300
Add Answer to:
Consider the Colombian market for soybeans. The following graph shows the domestic demand and domestic supply...
Consider the Colombian market for soybeans. The following graph shows the domestic demand and domestic supply...
 Consider the Colombian market for soybeans. The following graph shows the domestic demand and domestic supply curves for soybeans in Colombia. Suppose Colombia's government currently does not allow international trade in soybeans. Use the black point (plus symbol) to indicate the equilibrium price of a ton of soybeans and the equilibrium quantity of soybeans in Colombia in the absence of international trade. Then, use the green triangle (triangle symbol) to shade the area representing consumer surplus in equilibrium. Finally, use the purple...
The following graph shows the domestic demand and domestic supply curves for soybeans in Venezuela
 Consider the Venezuelan market for soybeans. The following graph shows the domestic demand and domestic supply curves for soybeans in Venezuela. Suppose Venezuela's government currently does not allow international trade in soybeans. Use the black point (plus symbol) to indicate the equilibrium price of a ton of soybeans and the equilibrium quantity of soybeans in Venezuela in the absence of international trade. Then, use the green triangle (triangle symbol) to shade the area representing consumer surplus in equilibrium. Finally, use the purple...
Consider the Bolivian market for lemons. The following graph shows the domestic demand and domestic supply...
 Consider the Bolivian market for lemons. The following graph shows the domestic demand and domestic supply curves for lemons in Bolivia. Suppose Bolivia's government currently does not allow international trade in lemons. Use the black point (plus symbol) to indicate the equilibrium price of a ton of lemons and the equilibrium quantity of lemons in Bolivia in the absence of international trade. Then, use the green triangle (triangle symbol) to shade the area representing consumer surplus in equilibrium. Finally, use...
Consider the Guatemalan market for tangerines. The following graph shows the domestic demand and domestic supply...
 Consider the Guatemalan market for tangerines. The following graph shows the domestic demand and domestic supply curves for tangerines in Guatemala. Suppose Guatemala's government currently does not allow international trade in tangerines Use the black point (plus symbol) to indicate the equilibrium price of a ton of tangerines and the equilibrium quantity of tangerines in Guatemala in the absence of international trade. Then, use the green triangle (triangle symbol) to shade the area representing consumer surplus in equilibrium. Finally, use...
Consider the Sudanese market for tangerines The following graph shows the domestic demand and domestic supply...
 Consider the Sudanese market for tangerines The following graph shows the domestic demand and domestic supply curves for tangerines in Sudan. Suppose Sudan's government currently does not allow international trade in tangerines Use the black point (plus symbol) to indicate the equilibrium price of a ton of tangerines and the equilibrium quantity of tangerines in Sudan in the absence of international trade. Then, use the green triangle (triangle symbol) to shade the area representing consumer surplus in equilibrium. Finally, use...
The following graph shows the domestic demand and domestic supply curves for lemons In Bolivia.
 Consider the Bolivian market for lemons. The following graph shows the domestic demand and domestic supply curves for lemons In Bolivia. Suppose Bolivia's government currently does not allow International trade In lemons. Use the black point (plus symbol) to Indicate the equilibrium price of a ton of lemons and the equilibrium quantity of lemons in Bolivia in the absence of International trade. Then, use the green triangle (triangle symbol) to shade the area representing consumer surplus In equilibrium. Finally, use the purple...
The following graph shows the domestic demand and domestic supply curves for tangerines in Panama. Suppose...
 The following graph shows the domestic demand and domestic supply curves for tangerines in Panama. Suppose Panama's government currently does not allow international trade in tangerines. Use the black point (plus symbol) to indicate the equilibrium price of a ton of tangerines and the equilibrium quantity of tangerines in Panama in the absence of international trade. Then, use the green triangle (triangle symbol) to shade the area representing consumer surplus in equilibrium. Finally, use the purple triangle (diamond symbol) to...
The following graph shows the domestic demand and domestic supply curves for lemons in New Zealand.
 The following graph shows the domestic demand and domestic supply curves for lemons in New Zealand. Suppose New Zealand's government currently does not allow international trade in lemons Use the black point (plus symbol) to indicate the equilibrium price of a ton of lemons and the equilibrium quantity of lemons in New Zealand in the absence of international trade. Then, use the green triangle (triangle symbol) to shade the area representing consumer surplus in equilibrium. Finally, use the purple triangle (diamond...
The following graph shows the domestic demand and domestic supply curves for lemons in Bolivia. Suppose Bolivia's government currently does not allow international trade in lemons.
 Consider the Bolivian market for lemons.The following graph shows the domestic demand and domestic
supply curves for lemons in Bolivia. Suppose Bolivia's government
currently does not allow international trade in lemons.Use the black point (plus symbol) to indicate the equilibrium
price of a ton of lemons and the equilibrium quantity of lemons in
Bolivia in the absence of international trade. Then, use the green
triangle (triangle symbol) to shade the area representing consumer
surplus in equilibrium. Finally, use the purple...
Consider the Bolivian market for lemons.The following graph shows the domestic demand and domestic
supply curves for lemons in Bolivia. Suppose Bolivia's government
currently does not allow international trade in lemons.Use the black point (plus symbol) to indicate the equilibrium
price of a ton of lemons and the equilibrium quantity of lemons in
Bolivia in the absence of international trade. Then, use the green
triangle (triangle symbol) to shade the area representing consumer
surplus in equilibrium. Finally, use the purple...
5. Welfare effects of a tariff in a small country Suppose Colombia is open to free...
 5. Welfare effects of a tariff in a small country Suppose Colombia is open to free trade in the world market for soybeans. Because of Colombia's small size, the demand for and supply of soybeans in Colombia do not affect the world price. The following graph shows the domestic soybeans market in Colombia. The world price of soybeans is Pw =$400 per ton. On the following graph, use the green triangle (triangle symbols) to shade the area representing consumer's surplus...
 Consider the Bolivian market for lemons. The following graph shows the domestic demand and domestic supply curves for lemons in Bolivia. Suppose Bolivia's government currently does not allow international trade in lemons. Use the black point (plus symbol) to indicate the equilibrium price of a ton of lemons and the equilibrium quantity of lemons in Bolivia in the absence of international trade. Then, use the green triangle (triangle symbol) to shade the area representing consumer surplus in equilibrium. Finally, use...
 Consider the Guatemalan market for tangerines. The following graph shows the domestic demand and domestic supply curves for tangerines in Guatemala. Suppose Guatemala's government currently does not allow international trade in tangerines Use the black point (plus symbol) to indicate the equilibrium price of a ton of tangerines and the equilibrium quantity of tangerines in Guatemala in the absence of international trade. Then, use the green triangle (triangle symbol) to shade the area representing consumer surplus in equilibrium. Finally, use...
 Consider the Sudanese market for tangerines The following graph shows the domestic demand and domestic supply curves for tangerines in Sudan. Suppose Sudan's government currently does not allow international trade in tangerines Use the black point (plus symbol) to indicate the equilibrium price of a ton of tangerines and the equilibrium quantity of tangerines in Sudan in the absence of international trade. Then, use the green triangle (triangle symbol) to shade the area representing consumer surplus in equilibrium. Finally, use...
 The following graph shows the domestic demand and domestic supply curves for tangerines in Panama. Suppose Panama's government currently does not allow international trade in tangerines. Use the black point (plus symbol) to indicate the equilibrium price of a ton of tangerines and the equilibrium quantity of tangerines in Panama in the absence of international trade. Then, use the green triangle (triangle symbol) to shade the area representing consumer surplus in equilibrium. Finally, use the purple triangle (diamond symbol) to...
 5. Welfare effects of a tariff in a small country Suppose Colombia is open to free trade in the world market for soybeans. Because of Colombia's small size, the demand for and supply of soybeans in Colombia do not affect the world price. The following graph shows the domestic soybeans market in Colombia. The world price of soybeans is Pw =$400 per ton. On the following graph, use the green triangle (triangle symbols) to shade the area representing consumer's surplus...
Most questions answered within 3 hours.
-
Describe the safeguards for the various file systems and assess
how effective they are
asked 11 seconds ago -
Write as assignment statement that assigns WA to an existing
string variable state. Visual Studio 2019....
asked 1 minute from now -
What is happening to the electron in the tube to make it deflect
more when Vd...
asked 21 minutes ago -
You start with 23.00g of aluminum and 55.00g of NH4ClO4. What is
the limiting reagent? 10Al(s)...
asked 27 minutes ago -
Find the errors in following program.
//This program uses a switch statement to assign a
//...
asked 28 minutes ago -
The mass structure of a spiral galaxy may be determined by
measurement of its___________ ________________
asked 38 minutes ago -
How do you define corrupt power? Lord Acton, a British historian
of the late 19th century,...
asked 35 minutes ago -
1. If demand deceases and supply remains constant, what happens
to the market equilibrium?
A. Quantity...
asked 42 minutes ago -
A ball of mass 81 kg is dropped from a height of 22 m. What is...
asked 42 minutes ago -
There are 3 golden retrievers, 2 dachshunds, and 4 chocolate
labs in a kennel. Two dogs...
asked 59 minutes ago -
When a fixture of real property is physically detached from the
real property, it is known...
asked 56 minutes ago -
Imagine you are driving around a horizontal circular track (such
as a roundabout at an intersection...
asked 1 hour ago