| MONTGOMERY INC. Comparative Balance Sheets December 31 |
||||||||||||
| Current Year | Prior Year | |||||||||||
| Assets | ||||||||||||
| Cash | $ | 34,500 | $ | 34,900 | ||||||||
| Accounts receivable, net | 10,000 | 12,400 | ||||||||||
| Inventory | 89,600 | 71,700 | ||||||||||
| Total current assets | 134,100 | 119,000 | ||||||||||
| Equipment | 49,600 | 42,400 | ||||||||||
| Accum. depreciation—Equipment | (22,400 | ) | (15,600 | ) | ||||||||
| Total assets | $ | 161,300 | $ | 145,800 | ||||||||
| Liabilities and Equity | ||||||||||||
| Accounts payable | $ | 23,800 | $ | 25,900 | ||||||||
| Salaries payable | 400 | 500 | ||||||||||
| Total current liabilities | 24,200 | 26,400 | ||||||||||
| Equity | ||||||||||||
| Common stock, no par value | 117,100 | 108,500 | ||||||||||
| Retained earnings | 20,000 | 10,900 | ||||||||||
| Total liabilities and equity | $ | 161,300 | $ | 145,800 | ||||||||
| MONTGOMERY INC. Income Statement For Current Year Ended December 31 |
|||||||
| Sales | $ | 39,600 | |||||
| Cost of goods sold | (16,400 | ) | |||||
| Gross profit | 23,200 | ||||||
| Operating expenses | |||||||
| Depreciation expense | $ | 6,800 | |||||
| Other expenses | 4,900 | ||||||
| Total operating expense | 11,700 | ||||||
| Income before taxes | 11,500 | ||||||
| Income tax expense | 2,400 | ||||||
| Net income | $ | 9,100 | |||||
Additional Information on Current-Year
Transactions
- No dividends are declared or paid.
- Issued additional stock for $8,600 cash.
- Purchased equipment for cash; no equipment was sold.
1. Use the above information to prepare a
statement of cash flows for the current year using the indirect
method. (Amounts to be deducted should be indicated by
a minus sign.)
Continued

OPtions for the 2nd and the 3rd last box for the left column
- Net income
- Net loss
Options for the left column
- Cash paid for equipment
- Cash received from stock issuance
- Decrease in accounts payable
- Decrease in accounts receivable
- Decrease in inventory
- Decrease in salaries payable
- Depreciation expense
- Increase in accounts payable
- Increase in accounts receivable
- Increase in inventory
- Increase in salaries payable
Homework Answers
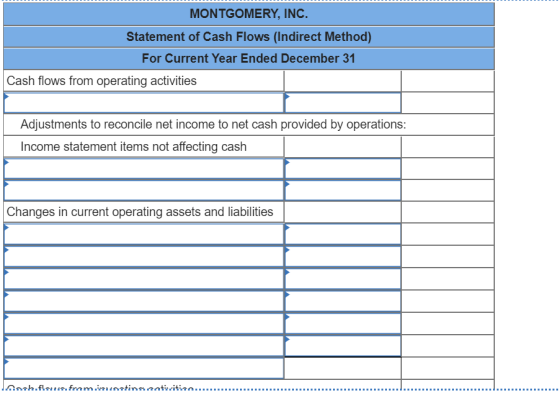
| MONTGOMERY, INC. | ||
| Statement of Cash Flows (Indirect Method) | ||
| For Current Year Ended December 31 | ||
| Cash flows from operating activities: | ||
| Net income | $9100 | |
| Adjustments to reconcile net income to net cash provided by operations: | ||
| Income statement items not affecting cash | ||
| Depreciation expense | 6800 | |
| Changes in current operating assets and liabilities | ||
| Decrease in accounts receivable (12400-10000) | 2400 | |
| Increase in inventories (89600-71700) | -17900 | |
| Decrease in accounts payable (25900-23800) | -2100 | |
| Decrease in salaries payable (500-400) | -100 | |
| 0 | ||
| 0 | ||
| Net cash used in operating activities | -1800 | |
| Cash flow from investing activities: | ||
| Cash paid for equipment (49600-42400) | -7200 | |
| 0 | ||
| Net cash used in investing activities | -7200 | |
| Cash flows from financing activities: | ||
| Cash received from stock issuance (117100-108500) | 8600 | |
| 0 | ||
| Net cash provided by financing activities | 8600 | |
| Net increase (decrease) in cash | $(400) | |
| Cash balance at beginning of the year | 34900 | |
| Cash balance at end of year | $34500 | |
If you have any problem regarding the answer please ask in the comment section.
Add Answer to:
MONTGOMERY INC.
Comparative Balance Sheets
December 31
Current Year
Prior Year
Assets
Cash
$
34,500
$...
Prior Year MONTGOMERY INC. Comparative Balance Sheets December 31 Current Year Assets Cash $ 31,000 Accounts...
 Prior Year MONTGOMERY INC. Comparative Balance Sheets December 31 Current Year Assets Cash $ 31,000 Accounts receivable, net 10,300 Inventory 92,400 Total current assets 133,700 Equipment 51,200 Accum. depreciation-Equipment (23, 100) Total assets $161,800 Liabilities and Equity Accounts payable $ 24,600 Salaries payable 500 Total current liabilities 25,100 Equity Common stock, no par value 112,800 Retained earnings 23,900 Total liabilities and equity $161,800 $ 31,200 12,600 72,800 116,600 43, 100 (16,000) $143,700 $ 26,600 600 27,200 103,400 13,100 $ 143,700...
MONTGOMERY INC. Comparative Balance Sheets December 31 Current Year Prior Year Assets Cash $ 30,400 $...
MONTGOMERY INC. Comparative Balance Sheets December 31 Current Year Prior Year Assets Cash $ 30,400 $ 30,550 Accounts receivable, net 10,050 12,150 Inventory 90,100 70,150 Total current assets 130,550 112,850 Equipment 49,900 41,500 Accum. depreciation—Equipment (22,500 ) (15,300 ) Total assets $ 157,950 $ 139,050 Liabilities and Equity Accounts payable $ 23,900 $ 25,400 Salaries payable 500 600 Total current liabilities 24,400 26,000 Equity Common stock, no par value 110,000 100,000 Retained earnings 23,550 13,050 Total liabilities and equity $...
Prior Year MONTGOMERY INC. Comparative Balance Sheets December 31 Current Year Assets Cash $ 32,300 Accounts...
 Prior Year MONTGOMERY INC. Comparative Balance Sheets December 31 Current Year Assets Cash $ 32,300 Accounts receivable, net 10,600 Inventory 95, 100 Total current assets 138,000 Equipment 52,700 Accum. depreciation-Equipment (23,880) Total assets $166,990 Liabilities and Equity Accounts payable $ 25,300 Salaries payable 500 Total current liabilities 25,800 Equity Common stock, no par value 117,300 Retained earnings 23,800 Total liabilities and equity $166,960 $ 32,400 13,000 75,1ee 120,500 44,500 16,580) $ 148,500 $ 27,400 600 28,000 107,400 13,160 $148,500 MONTGOMERY...
MONTGOMERY, INC Statement of Cash Flows (Indirect Method) For Year Ended December 31, 2018 Cash flows...
 MONTGOMERY, INC Statement of Cash Flows (Indirect Method) For Year Ended December 31, 2018 Cash flows from operating activities Net income Adjustments to reconcile net income to net cash provided by operations: Changes in current operating assets and liabilities Depreciation expense Decrease in accounts receivable Decrease in accounts payable Decrease in salaries payable Increase in inventory Net cash used in operating activities Cash flows from investing activities 0) Cash flows from financing activities 0 0 Cash balance at beginning of...
Please give correct answers Prior Year Comparative Balance Sheets December 31 Current Year Assets Cash $...
 Please give correct answers
Prior Year Comparative Balance Sheets December 31 Current Year Assets Cash $ 60,1ee Accounts receivable, net 19, see Inventory 177,500 Total current assets 257, 4ee Equipment 98, 3ee Accum. depreciation-Equipment (44,380) Total assets $311,480 Liabilities and Equity Accounts payable $ 47,100 Salaries payable 1.ee Total current liabilities 48, 100 Equity Common stock, no par value 216, 120 Retained earnings 47. 209 Total liabilities and equity $311, 4ee $ 60, eee 23,9ee 138, eee 221,9e 81,6ee (30,...
Please give correct answers
Prior Year Comparative Balance Sheets December 31 Current Year Assets Cash $ 60,1ee Accounts receivable, net 19, see Inventory 177,500 Total current assets 257, 4ee Equipment 98, 3ee Accum. depreciation-Equipment (44,380) Total assets $311,480 Liabilities and Equity Accounts payable $ 47,100 Salaries payable 1.ee Total current liabilities 48, 100 Equity Common stock, no par value 216, 120 Retained earnings 47. 209 Total liabilities and equity $311, 4ee $ 60, eee 23,9ee 138, eee 221,9e 81,6ee (30,...
Exercise 12-12 Indirect: Preparing statement of cash flows LO P2, P3 Prior Year MONTGOMERY INC. Comparative...
 Exercise 12-12 Indirect: Preparing statement of cash flows LO P2, P3 Prior Year MONTGOMERY INC. Comparative Balance Sheets December 31 Current Year Assets Cash $ 60,100 Accounts receivable, net 19,800 Inventory 177,500 Total current assets 257,400 Equipment 98,300 Accum. depreciation-Equipment (44,300) Total assets $311,400 Liabilities and Equity Accounts payable $ 47,100 Salaries payable 1,000 Total current liabilities 48,100 Equity Common stock, no par value 216,100 Retained earnings 47,200 Total liabilities and equity $311,480 $ 60,000 23,900 138,000 221,900 81,600 (30,...
Show calculations if applicable: 11 ΜΟΝTGOME RY INC. Comparative Balance Sheets December 31 0.83 Prior Year...
 Show calculations if applicable:
11 ΜΟΝTGOME RY INC. Comparative Balance Sheets December 31 0.83 Prior Year Current Year points Assets $ 58,200 18,300 Cash $58,100 22,300 128,800 209,200 76,200 Accounts receivable, net 164,100 240,600 90,900 Inventory еВook Total current assets Equipment Accum. depreciation- Equipment |(41,000) |(28,100) Print $257,300 $290,500 Total assets Liabilities and Equity Accounts payable Salaries payable References $ 43,600 $46,600 900 1,100 47,700 44,500 Total current liabilities Equity Common stock, no par 202,500 185,700 value Retained earnings 43,500...
Show calculations if applicable:
11 ΜΟΝTGOME RY INC. Comparative Balance Sheets December 31 0.83 Prior Year Current Year points Assets $ 58,200 18,300 Cash $58,100 22,300 128,800 209,200 76,200 Accounts receivable, net 164,100 240,600 90,900 Inventory еВook Total current assets Equipment Accum. depreciation- Equipment |(41,000) |(28,100) Print $257,300 $290,500 Total assets Liabilities and Equity Accounts payable Salaries payable References $ 43,600 $46,600 900 1,100 47,700 44,500 Total current liabilities Equity Common stock, no par 202,500 185,700 value Retained earnings 43,500...
GOLDEN CORPORATION Comparative Balance Sheets December 31 Current Year Prior Year Assets Cash $ 167,000 $...
GOLDEN CORPORATION Comparative Balance Sheets December 31 Current Year Prior Year Assets Cash $ 167,000 $ 110,300 Accounts receivable 87,500 74,000 Inventory 605,500 529,000 Total current assets 860,000 713,300 Equipment 343,000 302,000 Accum. depreciation—Equipment (159,500 ) (105,500 ) Total assets $ 1,043,500 $ 909,800 Liabilities and Equity Accounts payable $ 93,000 $ 74,000 Income taxes payable 31,000 26,600 Total current liabilities 124,000 100,600 Equity Common stock, $2 par value 595,600 571,000 Paid-in capital in excess of par value, common stock...
CRUZ, INC Comparative Balance Sheets December 31, 2019 2019 2018 Assets Cash 72,900 18,100 31,300 65,600...
 CRUZ, INC Comparative Balance Sheets December 31, 2019 2019 2018 Assets Cash 72,900 18,100 31,300 65,600 4000 Accounts receivable, net Inventory Prepaid expenses 38,400 72,100 3,300 Total current asseta 173,800 131,900 93,500 Furniture 80,600 (12,500) Accum. depreciation-Purniture (7,100) $218,300 $241,900 Total assets Liabilitios and Equity Aееounta payable Wages payable Ineone taxes payable Total current 1iabilities $11,400 6,800 1,200 19,400 24,800 44.200 16,100 3,800 2,100 22,000 55,800 77.800 Notes payable (long-tern) Total liabilities Equity Common stock, $5 par value Retained earnings...
2018 CRUZ, INC. Comparative Balance Sheets December 31, 2019 2019 Assets Cash $ 62,800 Accounts receivable,...
 2018 CRUZ, INC. Comparative Balance Sheets December 31, 2019 2019 Assets Cash $ 62,800 Accounts receivable, net 27.000 Inventory 56,600 Prepaid expenses 3,500 Total current assets 149,900 Furniture 70,500 Accum. depreciation-Furniture (10,900) Total assets $209,500 Liabilities and Equity Accounts payable $ 9,900 Wages payable 5,900 Income taxes payable 1.000 Total current liabilities 16,800 Notes payable (long-term) 20,700 Total liabilities 37,500 Equity Common stock, $5 par value 150,000 Retained earnings 22.000 Total liabilities and equity $209,500 $ 15,700 33.300 62,500 2,900...
 Prior Year MONTGOMERY INC. Comparative Balance Sheets December 31 Current Year Assets Cash $ 31,000 Accounts receivable, net 10,300 Inventory 92,400 Total current assets 133,700 Equipment 51,200 Accum. depreciation-Equipment (23, 100) Total assets $161,800 Liabilities and Equity Accounts payable $ 24,600 Salaries payable 500 Total current liabilities 25,100 Equity Common stock, no par value 112,800 Retained earnings 23,900 Total liabilities and equity $161,800 $ 31,200 12,600 72,800 116,600 43, 100 (16,000) $143,700 $ 26,600 600 27,200 103,400 13,100 $ 143,700...
 Prior Year MONTGOMERY INC. Comparative Balance Sheets December 31 Current Year Assets Cash $ 32,300 Accounts receivable, net 10,600 Inventory 95, 100 Total current assets 138,000 Equipment 52,700 Accum. depreciation-Equipment (23,880) Total assets $166,990 Liabilities and Equity Accounts payable $ 25,300 Salaries payable 500 Total current liabilities 25,800 Equity Common stock, no par value 117,300 Retained earnings 23,800 Total liabilities and equity $166,960 $ 32,400 13,000 75,1ee 120,500 44,500 16,580) $ 148,500 $ 27,400 600 28,000 107,400 13,160 $148,500 MONTGOMERY...
 MONTGOMERY, INC Statement of Cash Flows (Indirect Method) For Year Ended December 31, 2018 Cash flows from operating activities Net income Adjustments to reconcile net income to net cash provided by operations: Changes in current operating assets and liabilities Depreciation expense Decrease in accounts receivable Decrease in accounts payable Decrease in salaries payable Increase in inventory Net cash used in operating activities Cash flows from investing activities 0) Cash flows from financing activities 0 0 Cash balance at beginning of...
 Please give correct answers
Prior Year Comparative Balance Sheets December 31 Current Year Assets Cash $ 60,1ee Accounts receivable, net 19, see Inventory 177,500 Total current assets 257, 4ee Equipment 98, 3ee Accum. depreciation-Equipment (44,380) Total assets $311,480 Liabilities and Equity Accounts payable $ 47,100 Salaries payable 1.ee Total current liabilities 48, 100 Equity Common stock, no par value 216, 120 Retained earnings 47. 209 Total liabilities and equity $311, 4ee $ 60, eee 23,9ee 138, eee 221,9e 81,6ee (30,...
Please give correct answers
Prior Year Comparative Balance Sheets December 31 Current Year Assets Cash $ 60,1ee Accounts receivable, net 19, see Inventory 177,500 Total current assets 257, 4ee Equipment 98, 3ee Accum. depreciation-Equipment (44,380) Total assets $311,480 Liabilities and Equity Accounts payable $ 47,100 Salaries payable 1.ee Total current liabilities 48, 100 Equity Common stock, no par value 216, 120 Retained earnings 47. 209 Total liabilities and equity $311, 4ee $ 60, eee 23,9ee 138, eee 221,9e 81,6ee (30,...
 Exercise 12-12 Indirect: Preparing statement of cash flows LO P2, P3 Prior Year MONTGOMERY INC. Comparative Balance Sheets December 31 Current Year Assets Cash $ 60,100 Accounts receivable, net 19,800 Inventory 177,500 Total current assets 257,400 Equipment 98,300 Accum. depreciation-Equipment (44,300) Total assets $311,400 Liabilities and Equity Accounts payable $ 47,100 Salaries payable 1,000 Total current liabilities 48,100 Equity Common stock, no par value 216,100 Retained earnings 47,200 Total liabilities and equity $311,480 $ 60,000 23,900 138,000 221,900 81,600 (30,...
 Show calculations if applicable:
11 ΜΟΝTGOME RY INC. Comparative Balance Sheets December 31 0.83 Prior Year Current Year points Assets $ 58,200 18,300 Cash $58,100 22,300 128,800 209,200 76,200 Accounts receivable, net 164,100 240,600 90,900 Inventory еВook Total current assets Equipment Accum. depreciation- Equipment |(41,000) |(28,100) Print $257,300 $290,500 Total assets Liabilities and Equity Accounts payable Salaries payable References $ 43,600 $46,600 900 1,100 47,700 44,500 Total current liabilities Equity Common stock, no par 202,500 185,700 value Retained earnings 43,500...
Show calculations if applicable:
11 ΜΟΝTGOME RY INC. Comparative Balance Sheets December 31 0.83 Prior Year Current Year points Assets $ 58,200 18,300 Cash $58,100 22,300 128,800 209,200 76,200 Accounts receivable, net 164,100 240,600 90,900 Inventory еВook Total current assets Equipment Accum. depreciation- Equipment |(41,000) |(28,100) Print $257,300 $290,500 Total assets Liabilities and Equity Accounts payable Salaries payable References $ 43,600 $46,600 900 1,100 47,700 44,500 Total current liabilities Equity Common stock, no par 202,500 185,700 value Retained earnings 43,500...
 CRUZ, INC Comparative Balance Sheets December 31, 2019 2019 2018 Assets Cash 72,900 18,100 31,300 65,600 4000 Accounts receivable, net Inventory Prepaid expenses 38,400 72,100 3,300 Total current asseta 173,800 131,900 93,500 Furniture 80,600 (12,500) Accum. depreciation-Purniture (7,100) $218,300 $241,900 Total assets Liabilitios and Equity Aееounta payable Wages payable Ineone taxes payable Total current 1iabilities $11,400 6,800 1,200 19,400 24,800 44.200 16,100 3,800 2,100 22,000 55,800 77.800 Notes payable (long-tern) Total liabilities Equity Common stock, $5 par value Retained earnings...
 2018 CRUZ, INC. Comparative Balance Sheets December 31, 2019 2019 Assets Cash $ 62,800 Accounts receivable, net 27.000 Inventory 56,600 Prepaid expenses 3,500 Total current assets 149,900 Furniture 70,500 Accum. depreciation-Furniture (10,900) Total assets $209,500 Liabilities and Equity Accounts payable $ 9,900 Wages payable 5,900 Income taxes payable 1.000 Total current liabilities 16,800 Notes payable (long-term) 20,700 Total liabilities 37,500 Equity Common stock, $5 par value 150,000 Retained earnings 22.000 Total liabilities and equity $209,500 $ 15,700 33.300 62,500 2,900...
Most questions answered within 3 hours.
-
D. A student completed 20 courses in the School of Arts and
Sciences. Her grades in...
asked 48 minutes ago -
teo
pucks moving on a frictionless air table are about to collide. the
1.5 kg puck...
asked 54 minutes ago -
Problem #1
The area between Z = 0 and Z = 2.50
The area between Z...
asked 2 hours ago -
1. What is the meaning of the term communication style?
2. What are the benefits to...
asked 1 hour ago -
9.) You are buying a car that cost $26,500. You make payments of
$412 each month...
asked 2 hours ago -
. Suppose a discrete random variable has probability
distribution
P(x) = .2 if x = 0...
asked 3 hours ago -
Under the influence of its drive force, a snowmobile is moving
at a constant velocity along...
asked 4 hours ago -
Why do organizations decline? What steps can top
management take to halt, decline, and restore organizational...
asked 3 hours ago -
What mechanisms Drive speciation??
(I.e. what was Dawins theory on the orgin of species, and how...
asked 5 hours ago -
The manager at a car assembly plant believes that the mean
assembly time for a car...
asked 6 hours ago -
Which of the following is true of electron capture?
A) It decreases the nuclide's mass number...
asked 7 hours ago -
Assuming an efficiency of 43.10%, calculate the actual yield of
magnesium nitrate formed from 114.9 g...
asked 8 hours ago