
Homework Answers
Here, Consumption depends on both disposable income and real interest rate, that is,
C = C(Y – T, r)
a) If r increases:
- Savings increases as ‘r’ is the return to savings, that is, S’(r) > 0
- Consumption decreases as ‘r’ is the cost to borrowings, that is, C’(r) < 0
In other words, people want to earn a higher interest income on their savings and also credit becomes dear, decreasing consumption in the process.
b) From Savings-Investment identity, we know:
(Y – C – G) = I [Notations have their usual significance]
An increase in G immediately boosts demand for goods and services. Now since the total output is fixed by factors of production, an increase in G must be offset by decrease in some other components of demand.
Disposable income (Y – T) remains unchanged. So, consumption arising out of changes in disposable income remains unchanged.
So, the increase in G results in a decrease in Investment, I(r), which further results in decrease in rate of interest rate. This phenomenon is known as Crowding-Out Effect.
Now, for consumption arising out of changes in r, C(r) declines and thus correspondingly, S(r) increases, which might boost investment.
c) Considering a decrease in taxes, T by ΔT, disposable income is boosted by ΔT, thus increasing investment. Since now, Savings is dependent on r, an increase in Investment now results in increase in both equilibrium Investment and r. (Fig 1)
In contrast, when C(Y – T), Savings function is independent of
r, and is vertical. An increase in Investment now results in
increase in only and r. (Fig 2)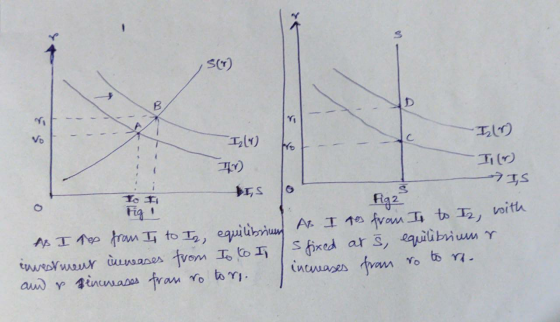
Add Answer to:
question 4
4. This question concerns how the consumption function affects the analysis of the loanable...
Macroeconomics (consumption, investment and loanable funds) question. The Current U.S. government spending is $4.746 trillion. That's...
Macroeconomics (consumption, investment and loanable funds) question. The Current U.S. government spending is $4.746 trillion. That's the federal budget for fiscal year 2020 covering October 1, 2019, to September 30, 2020. It's 21% of gross domestic product. That means that Government Spending in the United States has increased under the current U.S. Administration. Additionally, last year the Congress passed a tax reform that, among other effects, cut payroll taxes: i) Can you establish the macroeconomics effects of these policies on...
Using the model of loanable funds developed in Chapter 3, explain how the following changes affect...
Using the model of loanable funds developed in Chapter 3, explain how the following changes affect the real interest rate, investment, consumption, and government expenditure. Include the appropriate diagram as part of your answer in each case. Initially assume that consumption depends only on disposable income. (a) The government increases taxes. (b) Expectations about the future profitability of investment improve. (Hint: For a given real interest rate, r, firms will invest a greater amount after expectations improve). (c) How does...
A) Explain step-by-step how each of the following will affect the consumption and saving curves. Illustrate...
A) Explain step-by-step how each of the following will affect the consumption and saving curves. Illustrate your answers graphically (2 graphs for each). (3pts each) a. Consumers are afraid that prices will rise in the future. b. Income taxes are decreased. c. An increase in the price of houses and other assets. B) Explain step-by-step how each of the following will affect the demand for investment curve. Illustrate your answers graphically. (2.5pts each) a. A decrease in the real interest...
QUESTION 22 A decrease in the budget deficit a. may increase, decrease, or not affect investment...
QUESTION 22 A decrease in the budget deficit a. may increase, decrease, or not affect investment spending if private saving doesn’t change. b. makes investment spending fall. c. makes investment spending rise. d. does not affect investment spending. QUESTION 23 A larger budget deficit a. raises the interest rate and investment. b. raises the interest rate and reduces investment. c. reduces the interest rate and investment. d. reduces the interest rate and raises investment. QUESTION 24 A government budget deficit...
Question 2 In the Keynesian cross, assume that the consumption function is given by C =...
 Question 2 In the Keynesian cross, assume that the consumption function is given by C = 150 +0.7 (Y-T) Planned investment is: I = 100 – 10 *r Government purchases and taxes are both 50. a. Graph consumption as function of income. b. Graph investment as function of the real interest rate. c. Suppose that the real interest rate is 5. Write the equation of the planned expenditure. d. Suppose that the real interest rate is 5. What is the...
Solve 1. 2. 3. 4. 5. 1 Keynesian Cross Assume that households' consumption function is given...
 Solve 1. 2. 3. 4. 5.
1 Keynesian Cross Assume that households' consumption function is given by C(Y -T) 50+ 0.75(Y T), that firms' investment function is I(r) 150 10r, government spending is G 150, and the tax bill T 200. 1. What is the Marginal Propensity to Consume "MPC")? 2. What is the equilibrium level of real GDP in the goods market if the real interest rate is 5%? (Plug in r = 5 for 5%, rather than 0.05...
Solve 1. 2. 3. 4. 5.
1 Keynesian Cross Assume that households' consumption function is given by C(Y -T) 50+ 0.75(Y T), that firms' investment function is I(r) 150 10r, government spending is G 150, and the tax bill T 200. 1. What is the Marginal Propensity to Consume "MPC")? 2. What is the equilibrium level of real GDP in the goods market if the real interest rate is 5%? (Plug in r = 5 for 5%, rather than 0.05...
Part 1 - Use the loanable funds market to graphically show how real interest rate (r),...
Part 1 - Use the loanable funds market to graphically show how real interest rate (r), saving (S) and investment (I) would change when the goverment increase the tax rate on interest income. Explain in detail. Part 2 - Use the loanable funds market to graphically show how real interest rate (r), saving (S) and investment (I) would change when the goverment cut the tax rate on corporate prot. Explain in detail.
14. Consider the open-economy loanable funds model with flexible prices and capital mobility. Suppose that the...
 14. Consider the open-economy loanable funds model with flexible prices and capital mobility. Suppose that the world consists of a small open economy (we call this domestic) and the rest of the world (we call this foreign). Answer the following questions with the aid of figures where appropriate a. How does an increase in domestic government expenditure affect trade balance and real exchange rate? (2 points] b. How does an increase in foreign government expenditure affect the trade balance and...
6. Suppose there is a surplus in the market for loanable funds. Is the interest rate...
6. Suppose there is a surplus in the market for loanable funds. Is the interest rate above or below its equilibrium level? How do saving and investment at this interest rate be compared? Which one is greater? 7. If at some interest rate desired investment is $400 billion, desired private saving is $600 billion, and the budget deficit is $300 billion, is there a surplus or a shortage in the market for loanable funds? What does this imply would happen...
Consumption: ?? = 4 + 0.5(? − ?) Investment: ?? = 4 + 0.2? Government expenditure:...
Consumption: ?? = 4 + 0.5(? − ?) Investment: ?? = 4 + 0.2? Government expenditure: ? = 30 Tax revenue: T = 0.2? Exports: ? = 7 Imports: ? = 0.02 ? where Cd is consumption on domestically produced goods (remember: total consumption, C=Cd +M), Y is domestic output, G is government expenditure, M is imports, IP is planned investment spending, X is exports, and T is tax revenue. (i) Derive the equation for planned aggregate expenditure (PAE) on...
 Question 2 In the Keynesian cross, assume that the consumption function is given by C = 150 +0.7 (Y-T) Planned investment is: I = 100 – 10 *r Government purchases and taxes are both 50. a. Graph consumption as function of income. b. Graph investment as function of the real interest rate. c. Suppose that the real interest rate is 5. Write the equation of the planned expenditure. d. Suppose that the real interest rate is 5. What is the...
 Solve 1. 2. 3. 4. 5.
1 Keynesian Cross Assume that households' consumption function is given by C(Y -T) 50+ 0.75(Y T), that firms' investment function is I(r) 150 10r, government spending is G 150, and the tax bill T 200. 1. What is the Marginal Propensity to Consume "MPC")? 2. What is the equilibrium level of real GDP in the goods market if the real interest rate is 5%? (Plug in r = 5 for 5%, rather than 0.05...
Solve 1. 2. 3. 4. 5.
1 Keynesian Cross Assume that households' consumption function is given by C(Y -T) 50+ 0.75(Y T), that firms' investment function is I(r) 150 10r, government spending is G 150, and the tax bill T 200. 1. What is the Marginal Propensity to Consume "MPC")? 2. What is the equilibrium level of real GDP in the goods market if the real interest rate is 5%? (Plug in r = 5 for 5%, rather than 0.05...
 14. Consider the open-economy loanable funds model with flexible prices and capital mobility. Suppose that the world consists of a small open economy (we call this domestic) and the rest of the world (we call this foreign). Answer the following questions with the aid of figures where appropriate a. How does an increase in domestic government expenditure affect trade balance and real exchange rate? (2 points] b. How does an increase in foreign government expenditure affect the trade balance and...
Most questions answered within 3 hours.
-
Write a program to prompt the user for hours and rate per hour
using input to...
asked 18 seconds ago -
Hi, please help
1)Draw two molecules that could hydrogen bond with each other.
Draw and indicate...
asked 4 minutes ago -
Using Java, I created 3 files, Pizza,PizzaOrder, and
PizzaOrder_Demo that I attached down below. But I...
asked 3 minutes ago -
a. An 8-bit successive approximation ADC has a reference voltage
of 10 V. Calculate the resolution...
asked 13 minutes ago -
The distance between the two hydrogen nuclei in the H2 molecule
is 110 pm (picometer). How...
asked 14 minutes ago -
write an article about drone effect on
construction safety.
asked 18 minutes ago -
Consider the following data for a dependent variable y and two
independent variables, x1 and x2....
asked 1 hour ago -
what is the most likely shape for a distribution with a mean of
40 and a...
asked 29 minutes ago -
The work function, Φ0 (or W0), for cesium is 3.43×10⁻¹⁹ J. The
frequency of a photon...
asked 35 minutes ago -
18.54----At the surface of Venus the average temperature is a
balmy 460 ∘C due to the...
asked 34 minutes ago -
#1. A food has been ingested. Identify all of the anatomic
structures and substructures it travels...
asked 27 minutes ago -
Grommit Engineering expects to have net income next year of $
29.71 million and free cash...
asked 36 minutes ago