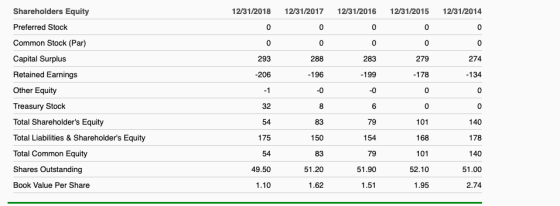
Calculate the Company's Free Cash Flow for 2018.


Homework Answers
Answer is given below

Add Answer to:
Calculate the Company's Free Cash Flow for
2018.
12/31/18 12/31/17 Sales Cost Of Goods Gross Profit...
Compute the following financial ratios for the company: Current ratio Acid-test ratio (also known as the...
 Compute the following financial ratios for the company:
Current ratio
Acid-test ratio (also known as the Quick ratio)
Operating return on assets
Gross profit margin
Operating profit margin
Net profit margin
Total asset turnover (TATO)
Fixed asset turnover (FATO)
Times interest earned (TIE)
Debt ratio
Return on equity (ROE)
Price/Earnings ratio (P/E)
Market/Book ratio
12/31/18 12/31/17 Sales Cost Of Goods Gross Profit Selling & Adminstrative & Depr. & Amort Expenses Income After Depreciation & Amortization Non-Operating Income Interest Expense Pretax...
Compute the following financial ratios for the company:
Current ratio
Acid-test ratio (also known as the Quick ratio)
Operating return on assets
Gross profit margin
Operating profit margin
Net profit margin
Total asset turnover (TATO)
Fixed asset turnover (FATO)
Times interest earned (TIE)
Debt ratio
Return on equity (ROE)
Price/Earnings ratio (P/E)
Market/Book ratio
12/31/18 12/31/17 Sales Cost Of Goods Gross Profit Selling & Adminstrative & Depr. & Amort Expenses Income After Depreciation & Amortization Non-Operating Income Interest Expense Pretax...
Prepare common-sized balance sheet and income statements for the company for 2017 and 2018. All values...
 Prepare common-sized balance sheet and income statements for the
company for 2017 and 2018. All values in millions except for per
share data. (In $, not %)
12/31/18 12/31/17 Sales Cost Of Goods Gross Profit Selling & Adminstrative & Depr. & Amort Expenses Income After Depreciation & Amortization Non-Operating Income Interest Expense Pretax Income -11 -21 -20 Income Taxes Minority Interest Investment Gains/Losses Other Income/Charges 0 0 00 -9 -20 - 0 22 Income From Cont. Operations Extras & Discontinued...
Prepare common-sized balance sheet and income statements for the
company for 2017 and 2018. All values in millions except for per
share data. (In $, not %)
12/31/18 12/31/17 Sales Cost Of Goods Gross Profit Selling & Adminstrative & Depr. & Amort Expenses Income After Depreciation & Amortization Non-Operating Income Interest Expense Pretax Income -11 -21 -20 Income Taxes Minority Interest Investment Gains/Losses Other Income/Charges 0 0 00 -9 -20 - 0 22 Income From Cont. Operations Extras & Discontinued...
($ thousands) Sales Cost of goods sold Gross profit Operating expenses Net income HAROUN COMPANY Comparative...
 ($ thousands) Sales Cost of goods sold Gross profit Operating expenses Net income HAROUN COMPANY Comparative Income Statements For Years Ended December 31, 2019-2013 2019 2018 2017 2016 2015 2014 2013 $1,536 $1,345 $1,224 $1,122 $1,047 $ 974 $ 798 1,104 898 772 676 628 587 468 432 447 452 446419 387 330 329 258 236 174 151 149 124 $ 103 $ 189 $ 216 $ 272 $ 268 $ 238 $ 206 HAROUN COMPANY Comparative Balance Sheets December...
($ thousands) Sales Cost of goods sold Gross profit Operating expenses Net income HAROUN COMPANY Comparative...
 ($ thousands) Sales Cost of goods sold Gross profit Operating expenses Net income HAROUN COMPANY Comparative Income Statements For Years Ended December 31, 2019-2013 2019 2018 2017 2016 2015 2014 2013 $1,536 $1,345 $1,224 $1,122 $1,047 $ 974 $ 798 1. 104 628 587 468 387 330 258 236 151 149 124 $ 216 $ 272 268 $ 238 $ 206 HAROUN COMPANY Comparative Balance Sheets December 31, 2019-2013 2019 2018 2017 2016 2015 2014 2013 $ 96 693 2,508...
(in millions) 2016 2015 Net sales 10,400 9,900 Cost of goods sold (5,500) (5,200) Gross profit...
 (in millions) 2016 2015 Net sales 10,400 9,900 Cost of goods sold (5,500) (5,200) Gross profit 4,900 4,700 Selling and administrative expenses (2,800) (2,700) Income from operations 2,100 2,000 Interest expense (300) (250) Income before income taxes 1,800 1,750 Income tax expense (420) (400) Net income 1,380 1,350 Smith and Sons, Inc. Balance Sheet 2016 2015 (in millions) Assets Current assets Cash and cash equivalents 550 750 Accounts receivable 900 800 Inventory 850 1,000 Other current assets 400 250 Total...
1) calculate Free Cash Flows to Equity for 2018. Include cash in all measures of working...
 1) calculate Free Cash Flows to Equity for 2018. Include cash in
all measures of working capital for purposes of these
calculations:
Jimmy's Corp. Annual Income Statements For Years Ending December 31 Sales Cost of sales Gross profit 2017 $156,121,419 55.330.466 100,790,953 2018 $173,219,147 60.213.877 113,005,270 Net operating expenses Operating income 84.109.861 16,681,092 94.003.364 19,001,906 Other income (expense) Interest expense (1,629,942) (1,680,884) (981,955) (2,109,889) Pretax net income 13,370,266 15,910,062 Taxes (sub S) Net income (loss) $13,370,266 $15,910,062 2018 Jimmy's Corp....
1) calculate Free Cash Flows to Equity for 2018. Include cash in
all measures of working capital for purposes of these
calculations:
Jimmy's Corp. Annual Income Statements For Years Ending December 31 Sales Cost of sales Gross profit 2017 $156,121,419 55.330.466 100,790,953 2018 $173,219,147 60.213.877 113,005,270 Net operating expenses Operating income 84.109.861 16,681,092 94.003.364 19,001,906 Other income (expense) Interest expense (1,629,942) (1,680,884) (981,955) (2,109,889) Pretax net income 13,370,266 15,910,062 Taxes (sub S) Net income (loss) $13,370,266 $15,910,062 2018 Jimmy's Corp....
CONSOLIDATED BALANCE SHEETS FOR TEST CORPORATION Oct 31, 2015 Oct 31, 2014 ASSETS Current Assets Cash...
 CONSOLIDATED BALANCE SHEETS FOR TEST CORPORATION Oct 31, 2015 Oct 31, 2014 ASSETS Current Assets Cash and Cash Equivalents Accounts Receivables Inventory Total Current Assets 700 150 200 100 700 1000 250 1100 600 600 Property, Plant, and Equipment Property, Plant and Equipment*** Less Cumulative Depreciation Total Property, Plant, and Equipment 200 250 350 400 Total Assets 1,450 1,400 LIABILITIES Current Liabilities Accounts Payable Other Current Liabilities Total Current Liabilities 100 200 100 200 300 500 Long-term Liabilities Loan Total...
Calculate percent of total revenue. Please show excel calculations. Common Size Statements of Cash Flow 12...
Calculate percent of total revenue. Please show excel calculations. Common Size Statements of Cash Flow 12 Months Ended Consolidated Statements of Cash Flows Dec. 31, 2018 % of Total Revenue Dec. 31, 2017 % of Total Revenue Dec. 31, 2016 % of Total Revenue CASH FLOWS FROM OPERATING ACTIVITIES Net income $216,355,000 $122,327,000 $106,712,000 Adjustments to reconcile net income to net cash provided by operating activities: Depreciation and amortization 14,330,000 6,680,000 6,996,000 Depreciation and amortization - marketing and reservation system...
Please calculate: a) Current Ratio & Acid test ratio b) Cash ratio & Operating cash flow...
 Please calculate:
a) Current Ratio & Acid test ratio
b) Cash ratio & Operating cash flow
c) Debt Ratio & Debt to equity ratio d) interest Ratio &
Debt service coverage Ratio
e) Assets turnover Ratio & Inventory turnover Ratio
Note As at 31 March 2018 2017 Taka Taka 4 5 OVO 511,585,227 6,188,057 58,510,013 11,504,048 28,563,337 616,350,682 593,536,255 9,118,422 76,756,882 10,366,331 41,750,162 731,528,052 9 10 11 12 Assets Property, plant and equipment Intangible assets Deferred tax assets Non-current financial...
Please calculate:
a) Current Ratio & Acid test ratio
b) Cash ratio & Operating cash flow
c) Debt Ratio & Debt to equity ratio d) interest Ratio &
Debt service coverage Ratio
e) Assets turnover Ratio & Inventory turnover Ratio
Note As at 31 March 2018 2017 Taka Taka 4 5 OVO 511,585,227 6,188,057 58,510,013 11,504,048 28,563,337 616,350,682 593,536,255 9,118,422 76,756,882 10,366,331 41,750,162 731,528,052 9 10 11 12 Assets Property, plant and equipment Intangible assets Deferred tax assets Non-current financial...
Prepare common-size statements in the framework provided? 2014 Coca-Cola 2015 2016 2017 2018 2014 Pepsi 2015...
 Prepare common-size statements in the framework provided?
2014 Coca-Cola 2015 2016 2017 2018 2014 Pepsi 2015 2016 2017 2018 45.9 44.5 42.0 32.1 66.71 11.8 179 30.9 63.5 28.8 28.2 64.7 29.4 33.3 Sales Cost of Revenue Gross Profit Operating Expenses Operating Profit Non-operating income 100 25.2 10.1 EBIT Interest solo EBT Taxes Net Income 4.9 | 2015 2016 2017 2018 2014 2015 2016 2017 2018 ASSETS 20 16.0 16.1 3 6.7 70 7.1 2.7 3.1 1.56 8.7 L 12.0...
Prepare common-size statements in the framework provided?
2014 Coca-Cola 2015 2016 2017 2018 2014 Pepsi 2015 2016 2017 2018 45.9 44.5 42.0 32.1 66.71 11.8 179 30.9 63.5 28.8 28.2 64.7 29.4 33.3 Sales Cost of Revenue Gross Profit Operating Expenses Operating Profit Non-operating income 100 25.2 10.1 EBIT Interest solo EBT Taxes Net Income 4.9 | 2015 2016 2017 2018 2014 2015 2016 2017 2018 ASSETS 20 16.0 16.1 3 6.7 70 7.1 2.7 3.1 1.56 8.7 L 12.0...
 Compute the following financial ratios for the company:
Current ratio
Acid-test ratio (also known as the Quick ratio)
Operating return on assets
Gross profit margin
Operating profit margin
Net profit margin
Total asset turnover (TATO)
Fixed asset turnover (FATO)
Times interest earned (TIE)
Debt ratio
Return on equity (ROE)
Price/Earnings ratio (P/E)
Market/Book ratio
12/31/18 12/31/17 Sales Cost Of Goods Gross Profit Selling & Adminstrative & Depr. & Amort Expenses Income After Depreciation & Amortization Non-Operating Income Interest Expense Pretax...
Compute the following financial ratios for the company:
Current ratio
Acid-test ratio (also known as the Quick ratio)
Operating return on assets
Gross profit margin
Operating profit margin
Net profit margin
Total asset turnover (TATO)
Fixed asset turnover (FATO)
Times interest earned (TIE)
Debt ratio
Return on equity (ROE)
Price/Earnings ratio (P/E)
Market/Book ratio
12/31/18 12/31/17 Sales Cost Of Goods Gross Profit Selling & Adminstrative & Depr. & Amort Expenses Income After Depreciation & Amortization Non-Operating Income Interest Expense Pretax...
 Prepare common-sized balance sheet and income statements for the
company for 2017 and 2018. All values in millions except for per
share data. (In $, not %)
12/31/18 12/31/17 Sales Cost Of Goods Gross Profit Selling & Adminstrative & Depr. & Amort Expenses Income After Depreciation & Amortization Non-Operating Income Interest Expense Pretax Income -11 -21 -20 Income Taxes Minority Interest Investment Gains/Losses Other Income/Charges 0 0 00 -9 -20 - 0 22 Income From Cont. Operations Extras & Discontinued...
Prepare common-sized balance sheet and income statements for the
company for 2017 and 2018. All values in millions except for per
share data. (In $, not %)
12/31/18 12/31/17 Sales Cost Of Goods Gross Profit Selling & Adminstrative & Depr. & Amort Expenses Income After Depreciation & Amortization Non-Operating Income Interest Expense Pretax Income -11 -21 -20 Income Taxes Minority Interest Investment Gains/Losses Other Income/Charges 0 0 00 -9 -20 - 0 22 Income From Cont. Operations Extras & Discontinued...
 ($ thousands) Sales Cost of goods sold Gross profit Operating expenses Net income HAROUN COMPANY Comparative Income Statements For Years Ended December 31, 2019-2013 2019 2018 2017 2016 2015 2014 2013 $1,536 $1,345 $1,224 $1,122 $1,047 $ 974 $ 798 1,104 898 772 676 628 587 468 432 447 452 446419 387 330 329 258 236 174 151 149 124 $ 103 $ 189 $ 216 $ 272 $ 268 $ 238 $ 206 HAROUN COMPANY Comparative Balance Sheets December...
 ($ thousands) Sales Cost of goods sold Gross profit Operating expenses Net income HAROUN COMPANY Comparative Income Statements For Years Ended December 31, 2019-2013 2019 2018 2017 2016 2015 2014 2013 $1,536 $1,345 $1,224 $1,122 $1,047 $ 974 $ 798 1. 104 628 587 468 387 330 258 236 151 149 124 $ 216 $ 272 268 $ 238 $ 206 HAROUN COMPANY Comparative Balance Sheets December 31, 2019-2013 2019 2018 2017 2016 2015 2014 2013 $ 96 693 2,508...
 (in millions) 2016 2015 Net sales 10,400 9,900 Cost of goods sold (5,500) (5,200) Gross profit 4,900 4,700 Selling and administrative expenses (2,800) (2,700) Income from operations 2,100 2,000 Interest expense (300) (250) Income before income taxes 1,800 1,750 Income tax expense (420) (400) Net income 1,380 1,350 Smith and Sons, Inc. Balance Sheet 2016 2015 (in millions) Assets Current assets Cash and cash equivalents 550 750 Accounts receivable 900 800 Inventory 850 1,000 Other current assets 400 250 Total...
 1) calculate Free Cash Flows to Equity for 2018. Include cash in
all measures of working capital for purposes of these
calculations:
Jimmy's Corp. Annual Income Statements For Years Ending December 31 Sales Cost of sales Gross profit 2017 $156,121,419 55.330.466 100,790,953 2018 $173,219,147 60.213.877 113,005,270 Net operating expenses Operating income 84.109.861 16,681,092 94.003.364 19,001,906 Other income (expense) Interest expense (1,629,942) (1,680,884) (981,955) (2,109,889) Pretax net income 13,370,266 15,910,062 Taxes (sub S) Net income (loss) $13,370,266 $15,910,062 2018 Jimmy's Corp....
1) calculate Free Cash Flows to Equity for 2018. Include cash in
all measures of working capital for purposes of these
calculations:
Jimmy's Corp. Annual Income Statements For Years Ending December 31 Sales Cost of sales Gross profit 2017 $156,121,419 55.330.466 100,790,953 2018 $173,219,147 60.213.877 113,005,270 Net operating expenses Operating income 84.109.861 16,681,092 94.003.364 19,001,906 Other income (expense) Interest expense (1,629,942) (1,680,884) (981,955) (2,109,889) Pretax net income 13,370,266 15,910,062 Taxes (sub S) Net income (loss) $13,370,266 $15,910,062 2018 Jimmy's Corp....
 CONSOLIDATED BALANCE SHEETS FOR TEST CORPORATION Oct 31, 2015 Oct 31, 2014 ASSETS Current Assets Cash and Cash Equivalents Accounts Receivables Inventory Total Current Assets 700 150 200 100 700 1000 250 1100 600 600 Property, Plant, and Equipment Property, Plant and Equipment*** Less Cumulative Depreciation Total Property, Plant, and Equipment 200 250 350 400 Total Assets 1,450 1,400 LIABILITIES Current Liabilities Accounts Payable Other Current Liabilities Total Current Liabilities 100 200 100 200 300 500 Long-term Liabilities Loan Total...
 Please calculate:
a) Current Ratio & Acid test ratio
b) Cash ratio & Operating cash flow
c) Debt Ratio & Debt to equity ratio d) interest Ratio &
Debt service coverage Ratio
e) Assets turnover Ratio & Inventory turnover Ratio
Note As at 31 March 2018 2017 Taka Taka 4 5 OVO 511,585,227 6,188,057 58,510,013 11,504,048 28,563,337 616,350,682 593,536,255 9,118,422 76,756,882 10,366,331 41,750,162 731,528,052 9 10 11 12 Assets Property, plant and equipment Intangible assets Deferred tax assets Non-current financial...
Please calculate:
a) Current Ratio & Acid test ratio
b) Cash ratio & Operating cash flow
c) Debt Ratio & Debt to equity ratio d) interest Ratio &
Debt service coverage Ratio
e) Assets turnover Ratio & Inventory turnover Ratio
Note As at 31 March 2018 2017 Taka Taka 4 5 OVO 511,585,227 6,188,057 58,510,013 11,504,048 28,563,337 616,350,682 593,536,255 9,118,422 76,756,882 10,366,331 41,750,162 731,528,052 9 10 11 12 Assets Property, plant and equipment Intangible assets Deferred tax assets Non-current financial...
 Prepare common-size statements in the framework provided?
2014 Coca-Cola 2015 2016 2017 2018 2014 Pepsi 2015 2016 2017 2018 45.9 44.5 42.0 32.1 66.71 11.8 179 30.9 63.5 28.8 28.2 64.7 29.4 33.3 Sales Cost of Revenue Gross Profit Operating Expenses Operating Profit Non-operating income 100 25.2 10.1 EBIT Interest solo EBT Taxes Net Income 4.9 | 2015 2016 2017 2018 2014 2015 2016 2017 2018 ASSETS 20 16.0 16.1 3 6.7 70 7.1 2.7 3.1 1.56 8.7 L 12.0...
Prepare common-size statements in the framework provided?
2014 Coca-Cola 2015 2016 2017 2018 2014 Pepsi 2015 2016 2017 2018 45.9 44.5 42.0 32.1 66.71 11.8 179 30.9 63.5 28.8 28.2 64.7 29.4 33.3 Sales Cost of Revenue Gross Profit Operating Expenses Operating Profit Non-operating income 100 25.2 10.1 EBIT Interest solo EBT Taxes Net Income 4.9 | 2015 2016 2017 2018 2014 2015 2016 2017 2018 ASSETS 20 16.0 16.1 3 6.7 70 7.1 2.7 3.1 1.56 8.7 L 12.0...
Most questions answered within 3 hours.
-
Write a program to solve the Josephus problem, with the following
modification:
Sample Input:
./a.out n...
asked 1 hour ago -
At the start of a CD it is spinning at a rate of 525 rpm
(revolutions...
asked 1 hour ago -
4. Without doing any calculations, predict whether the observed
∆T would increase, decrease or remain the...
asked 3 hours ago -
Based on the range, which of the following sets of scores has
the greatest variability? 3,...
asked 4 hours ago -
Ripples in a pond travel at a velocity of 3 m/s with one peak
passing a...
asked 4 hours ago -
A man stands on the roof of a building of height 13.0 mm and
throws a...
asked 4 hours ago -
The extent to which assets are financed by borrowed funds and
other liabilities is indicated by:...
asked 5 hours ago -
Explain in detail
Germany is the fifth largest economy
explain what goods and services Germany specializes...
asked 5 hours ago -
The density of platinum is 21.45 g/mL. If a cube of platinum
with a mass of...
asked 5 hours ago -
Accounts Receivable
Sales
A/R Posting
Extended Sales Invoice
Packing Slip
Compare invoice to packing slip 2...
asked 5 hours ago -
Michaella, age 23, is a full-time law student and is claimed by
her parents as a...
asked 5 hours ago -
Why are polymers not typically casted into products?
asked 5 hours ago