
Homework Answers
Answer : 1) Law of demand : The law of demand states that if price rise then quantity demanded decrease and if price fall then the quantity demanded increase.
2) Law of supply : The law of supply states that if price rise then the quantity supplied increase and if price fall then the quantity supplied decrease.
3) In the following diagram the demand curve is D and the supply curve is S. In the diagram E is the equilibrium point. The equilibrium price is P and the equilibrium quantity is Q.
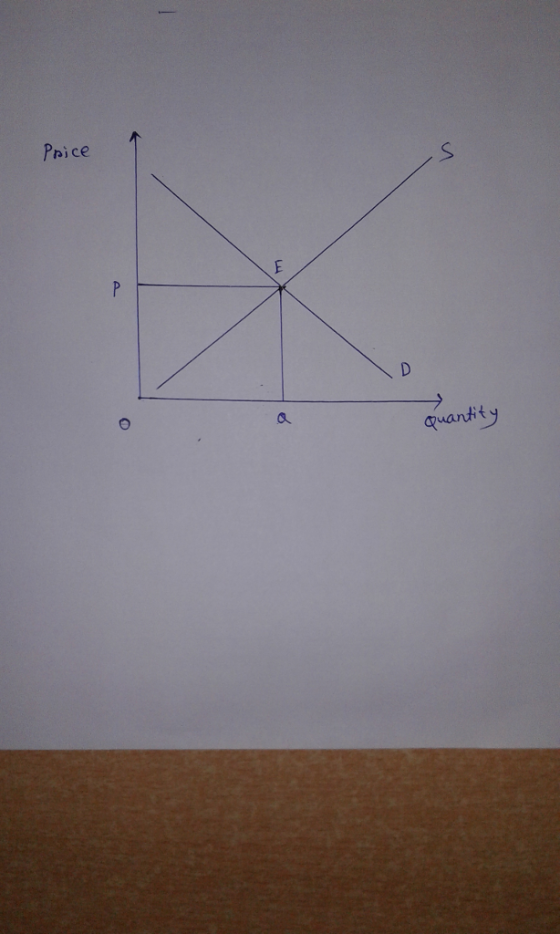
4) In the following diagram the initial equilibrium point is E. At point E the equilibrium price is P and quantity is Q.
Now, demand curve shifts to rightward due to increase in demand. The new demand curve is D'. The new equilibrium point is E1 . New equilibrium price is P1 . New equilibrium quantity is Q1 .

a) From the above diagram it is clear that the new equilibrium price P1 is higher than the old price level P.
The new equilibrium quantity Q1 is higher than the old quantity level Q.
Add Answer to:
1. Describe the law of demand. 2. Describe the law of supply 3. Draw a supply...
3. Draw a supply and demand diagram. Label each axis, the demand curve, the supply curve,...
 3. Draw a supply and demand diagram. Label each axis, the demand curve, the supply curve, and the equilibrium price and quantity a. Show the impact of an increase in supply. Label the new curve, the new equilibrium price, and the new equilibrium quantity b. Did the equilibrium price increase, decrease, or stay the same? c. Did the equilibrium quantity increase, decrease, or stay the same? 4. Draw a supply and demand diagram. Label each axis, the demand curve, the...
1. Drauw a supply and demand diagram. Label each axis, the demand curve, the supply curve...
 1. Drauw a supply and demand diagram. Label each axis, the demand curve, the supply curve andl ehe equilibrium price and quantity a. Show the impact of an increase in demand Label the new curve, the new equilibrium price, and the new equilibrium quantity b. Did the equilibrium price increase, decrease, or stay the same? c. Did the equilibrium quantity increase, decrease, or stay the same? 2. Draw a supply and demand diagram. Label each axis, the demand curve, the...
Name: Student ID 1) Draw the supply curve and demand curve to illustrate the market for...
 Name: Student ID 1) Draw the supply curve and demand curve to illustrate the market for Netflix subscriptions for each of the following parts a, b, and e. Label the supply curve S, and the demand curve D. Mark the initial equilibrium point , with an initial equilibrium price of Pand equilibrium quantity of Qi. a) Illustrate the effect of Netflix signing an exclusivity deal to stream popular anime. If the demand curve shifts, label the new demand curve D....
. Why is it inefficient When a market produces, selis and consumes & quan equilibrium quantity?...
 . Why is it inefficient When a market produces, selis and consumes & quan equilibrium quantity? 2. Why is it inefficient when a market produces, sells and consumes a quantity that is more than the equilibrium quantity? 3. Draw a supply and demand diagram. Label cach axis, the demand curve, the supply curve, the ity hae es mm me equilibrium price, and the equilibrium quantity. Show the impact of a decrease in supply. Label the new equilibrium price and quantity....
Answer A-I please (a) Draw a Supply Curve and the Demand Curve for the US Auto market. Label the supply S1 and the demand D1. Label the vertical axis P for Price and label the horizontal axis Q for Qu...
Answer A-I please (a) Draw a Supply Curve and the Demand Curve for the US Auto market. Label the supply S1 and the demand D1. Label the vertical axis P for Price and label the horizontal axis Q for Quantity of Milk. Label on the vertical axis the equilibrium price as P1. Label on the horizontal axis the equilibrium quantity as Q1. Assume now that a tariff of 25% is placed on on all steel and aluminum that is imported...
Refer to the diagram to the right: 1) Use the line drawing tool to draw a...
 Refer to the diagram to the right: 1) Use the line drawing tool to draw a demand curve that shifts to the right. Label this line 'De 2) Use the line drawing tool to draw a supply curve that shifts to the right by less than the demand line. Label this line 'S 3) Use the point drawing tool to identify the new point of equilibrium. Label this point 'B' Price Carefully follow the instructions above, and only draw the...
Draw a supply and demand curve for the Nike tennis shoe market. Label both axes and...
Draw a supply and demand curve for the Nike tennis shoe market. Label both axes and all curves Find and label equilibrium price and quantity (label them p1 and q1) Draw an increase in demand (label the new curve d2) Find and label the new equilibrium price and quantity (label them p2 and q2) Using the factors that shift demand, give an example of an event that could increase the demand curve for Nike tennis shoes.
Draw and label a graph illustrating a demand and supply of anything. Show how an increase...
Draw and label a graph illustrating a demand and supply of anything. Show how an increase in supply and a decrease in demand could result in a lower equilibrium price and a lower equilibrium quantity. Draw and label a graph illustrating a demand and supply of anything. Show how an increase in supply and a decrease in demand could result in a lower equilibrium price and a greater equilibrium quantity.
5) Which of the following is likely to lead to a right shift in the supply...
5) Which of the following is likely to lead to a right shift in the supply curve of cotton? 5) _______ A) An increase in the price of cotton B) A decrease in the price of cotton C) An increase in labor productivity due to training programs D) A rise in labor costs due to wage demands by labor unions 6) Assume that the supply curve for a commodity shifts to the left and the demand curve shifts to the...
13. An increase in the demand for a product means that the a. supply curve shifts...
 13. An increase in the demand for a product means that the a. supply curve shifts to the left. b. demand curve shifts to the right. C. supply curve shifts to the right. d. demand curve shifts to the left. Exhibit 3-15 Supply and demand curres for good X Price per unit (dollars) 100 200 300 400 Quantity of pedx (unis per time period 14.- In the market shown in Exhibit 3-15, the equilibrium price and quantity of good X...
 3. Draw a supply and demand diagram. Label each axis, the demand curve, the supply curve, and the equilibrium price and quantity a. Show the impact of an increase in supply. Label the new curve, the new equilibrium price, and the new equilibrium quantity b. Did the equilibrium price increase, decrease, or stay the same? c. Did the equilibrium quantity increase, decrease, or stay the same? 4. Draw a supply and demand diagram. Label each axis, the demand curve, the...
 1. Drauw a supply and demand diagram. Label each axis, the demand curve, the supply curve andl ehe equilibrium price and quantity a. Show the impact of an increase in demand Label the new curve, the new equilibrium price, and the new equilibrium quantity b. Did the equilibrium price increase, decrease, or stay the same? c. Did the equilibrium quantity increase, decrease, or stay the same? 2. Draw a supply and demand diagram. Label each axis, the demand curve, the...
 Name: Student ID 1) Draw the supply curve and demand curve to illustrate the market for Netflix subscriptions for each of the following parts a, b, and e. Label the supply curve S, and the demand curve D. Mark the initial equilibrium point , with an initial equilibrium price of Pand equilibrium quantity of Qi. a) Illustrate the effect of Netflix signing an exclusivity deal to stream popular anime. If the demand curve shifts, label the new demand curve D....
 . Why is it inefficient When a market produces, selis and consumes & quan equilibrium quantity? 2. Why is it inefficient when a market produces, sells and consumes a quantity that is more than the equilibrium quantity? 3. Draw a supply and demand diagram. Label cach axis, the demand curve, the supply curve, the ity hae es mm me equilibrium price, and the equilibrium quantity. Show the impact of a decrease in supply. Label the new equilibrium price and quantity....
 Refer to the diagram to the right: 1) Use the line drawing tool to draw a demand curve that shifts to the right. Label this line 'De 2) Use the line drawing tool to draw a supply curve that shifts to the right by less than the demand line. Label this line 'S 3) Use the point drawing tool to identify the new point of equilibrium. Label this point 'B' Price Carefully follow the instructions above, and only draw the...
 13. An increase in the demand for a product means that the a. supply curve shifts to the left. b. demand curve shifts to the right. C. supply curve shifts to the right. d. demand curve shifts to the left. Exhibit 3-15 Supply and demand curres for good X Price per unit (dollars) 100 200 300 400 Quantity of pedx (unis per time period 14.- In the market shown in Exhibit 3-15, the equilibrium price and quantity of good X...
Most questions answered within 3 hours.
-
For
a test of independent groups, a t test can still be conducted even
when assumptions...
asked 2 minutes ago -
What assumption are we making about ratings e.g., that ratings
are important in motivating poor performers...
asked 9 minutes ago -
You’ve observed the following returns on Crash-n-Burn Computer’s
stock over the past five years: 11 percent,...
asked 11 minutes ago -
In which of the following cases is the displacement's
magnitude half the distance traveled? a. 10...
asked 31 minutes ago -
(InputMismatchException) and (ArrayIndexOutOfBoundsException):
Using the two arrays shown below, write a program that prompts the
user...
asked 27 minutes ago -
A basketball of mass m = 630 g rolls off the hoop's rim, falls
from a...
asked 47 minutes ago -
What is the activity [A] of Na+ in a .05M solution of NaCl at
25C? You...
asked 47 minutes ago -
You own a bond portfolio worth $41,000. You estimate that your
portfolio has an average YTM...
asked 56 minutes ago -
Assume a binomial probability distribution with n=40 and π=0.26.
Compute the following:
A.) The Mean and...
asked 1 hour ago -
A 2.1-cm-tall object is 19.2 cm to the left of a lens with focal
length of...
asked 1 hour ago -
In
EXCEL VBA:
How would I manage to do this in VBA?
The assignment is in...
asked 1 hour ago -
what is the statistical probability of 2 caucasians
having identical STR profiles
asked 1 hour ago