
Homework Answers
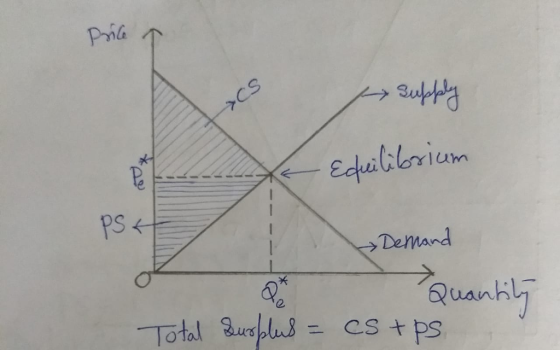
3. Refer the attached picture below
Now when supply curve shifts to left that is supply decreases. Refer the attached picture below
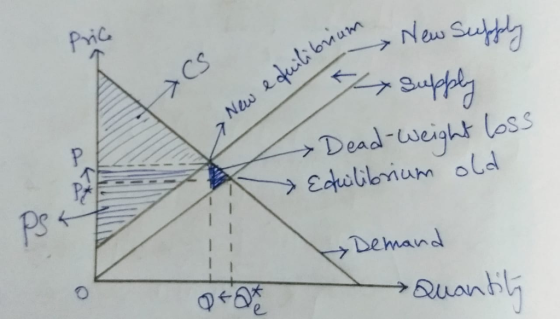
3a. Equilibrium price is higher.
3b. New equilibrium quantity is less than old equilibrium quantity.
3c. Refer the two pictures Consumer Surplus is less than previous consumer surplus.
3d. Yes the producer surplus is greater than previous case. In second picture the PS also included the area between old and new demand curve.
3e. Total surplus will be less than other since here after the shift in supply deadweight loss is there. Hence new total surplus is less than old total surplus.
I feel I have tried to answer as per your requirement. Kindly contact before rating up will be obliged to you for your generous support thank you.
Add Answer to:
. Why is it inefficient When a market produces, selis and consumes & quan equilibrium quantity?...
This assignment asks you to solve for equilibrium in a market and then look at the...
 This assignment asks you to solve for equilibrium in a market and then look at the impact of a price ceiling, a price floor and a tax. The correct answers to these questions will vary across students. This is because the numerical values of some parameters are dependent on your student members. Suppose supply and demand for pizza are given by: Q" = 110 - OP QS = BP If the last digit of your student number is not 0,...
1. Describe the law of demand. 2. Describe the law of supply 3. Draw a supply...
 1. Describe the law of demand. 2. Describe the law of supply 3. Draw a supply and demand diagram. Label each axis, the demand curve, the supply curve, the equilibrium price, and the equilibrium quantity. 4. Cons demand curve shifts to the right. This will create a new equilibrium price and ider that a market begins in equilibrium. If there is an increase in demand, it means that the quantity a. Compared to the old equilibrium price, is the new...
When examining the graph below, which describes the chain of events the market follows to reach...
 When examining the graph below, which describes the chain of events the market follows to reach a new equilibrium? S2 01 There is a decrease supply, creating a surplus, price begins to move resulting in a higher equilibrium price and lower equilibrium quantity There is an increase in supply, creating a surplus, price begins to move resulting in a higher equilibrium price and lower equilibrium quantity There is an increase in supply creating a surplus, price begins to move resulting...
Consider the market for oranges in the US. Suppose we begin with an equilibrium in this...
 Consider the market for oranges in the US. Suppose we begin with an equilibrium in this market, where quantity produced is equal to quantity demanded, which is equal to 5 million tons of oranges. Further suppose the price of a pound of oranges is $2.50. a. Illustrate this equilibrium by using supply and demand curves. Don't forget to label the axes, show the equilibrium quantity and the equilibrium price. (5 pts) b. Now suppose a tropical storm hits Florida destroying...
het happens to equilibrium price and quantity in the market 50 pickup irucks if the price...
 het happens to equilibrium price and quantity in the market 50 pickup irucks if the price of Chevy Silverado pickup trucks goes fown. Show a graph of label each axis and the demand and supply curves. ply for Ford F150 and be sure to properly Please state what will happen to the current equilibrium price and quantity in the market for gasoline if there is an expectation of higher gasoline prices in the immediate future. Show a graph of demand/supply...
12. A market is said to be in equilibrium when: A Quantity demanded equals quantity supplied...
 12. A market is said to be in equilibrium when: A Quantity demanded equals quantity supplied B. Production costs equal revenues from sale of the output C. The number of sellers equals the number of buyers D. People's needs are fully met 13. At the equilibrium prices: A. There are shortages but no surpluses B. There are surpluses but no shortages C. The economic problem of scarcity is no longer relevant D. There are no shortages or surpluses 14. An...
1. Evaluate whether the statement is true or false. Explain why Competitive firm never produces when it is making a...
 1. Evaluate whether the statement is true or false. Explain why Competitive firm never produces when it is making a negative profit. a. b. In cost minimization, as wage increases, a firm will always decreases labour input Long run market supply curve in perfect competition is horizontal C. d. If price is lower than equilibrium price, consumer surplus is higher than the equilibrium since consumers can enjoy lower price.
1. Evaluate whether the statement is true or false. Explain why...
1. Evaluate whether the statement is true or false. Explain why Competitive firm never produces when it is making a negative profit. a. b. In cost minimization, as wage increases, a firm will always decreases labour input Long run market supply curve in perfect competition is horizontal C. d. If price is lower than equilibrium price, consumer surplus is higher than the equilibrium since consumers can enjoy lower price.
1. Evaluate whether the statement is true or false. Explain why...
Q=100,000-10,000P solve for the consumer surplus at the equilibrium price and quantity Demand: Let the Market...
 Q=100,000-10,000P solve for the consumer surplus at the
equilibrium price and quantity
Demand: Let the Market Demand curve for soybeans be given by the following equation: Q=100,000 -10,000P where the quantity of soybeans in kilograms P = the price of soybeans in dollars per kilogram. Supply: Let the Market Supply curve for soybeans be given by the equation: Q=-5,000+ 5,000P 3) Consumer Surplus: The Consumer Surplus (CS) is the triangular area under the demand curve and above the equilibrium price....
Q=100,000-10,000P solve for the consumer surplus at the
equilibrium price and quantity
Demand: Let the Market Demand curve for soybeans be given by the following equation: Q=100,000 -10,000P where the quantity of soybeans in kilograms P = the price of soybeans in dollars per kilogram. Supply: Let the Market Supply curve for soybeans be given by the equation: Q=-5,000+ 5,000P 3) Consumer Surplus: The Consumer Surplus (CS) is the triangular area under the demand curve and above the equilibrium price....
. (9 points) The daily market for cups of chai tea at Jeff’s Espresso is given...
. (9 points) The daily market for cups of chai tea at Jeff’s Espresso is given by the following supply and demand equations. QD =160−20P QS = 20P Please answer the following questions about this market: a. Draw the supply and demand curves below. Be sure to label the y-intercepts of each graph and the equilibrium and label the supply curve S. Solve for the equilibrium price and quantity in this market. b. What is the consumer surplus in this...
(a) What determines the price in a market? (b) Why is this price considered efficient? (c)...
(a) What determines the price in a market? (b) Why is this price considered efficient? (c) Why do prices in markets rise and fall? (d) Why is it actually wrong to say that “If the price in a market increases, then that’s a bad thing? (a) In economics, what are inferior goods? (b) Are inferior goods always of inferior quality? (c) In the market for adult entertainment, identify two goods that are substitutes. (d) In the market for plastic surgery,...
 This assignment asks you to solve for equilibrium in a market and then look at the impact of a price ceiling, a price floor and a tax. The correct answers to these questions will vary across students. This is because the numerical values of some parameters are dependent on your student members. Suppose supply and demand for pizza are given by: Q" = 110 - OP QS = BP If the last digit of your student number is not 0,...
 1. Describe the law of demand. 2. Describe the law of supply 3. Draw a supply and demand diagram. Label each axis, the demand curve, the supply curve, the equilibrium price, and the equilibrium quantity. 4. Cons demand curve shifts to the right. This will create a new equilibrium price and ider that a market begins in equilibrium. If there is an increase in demand, it means that the quantity a. Compared to the old equilibrium price, is the new...
 When examining the graph below, which describes the chain of events the market follows to reach a new equilibrium? S2 01 There is a decrease supply, creating a surplus, price begins to move resulting in a higher equilibrium price and lower equilibrium quantity There is an increase in supply, creating a surplus, price begins to move resulting in a higher equilibrium price and lower equilibrium quantity There is an increase in supply creating a surplus, price begins to move resulting...
 Consider the market for oranges in the US. Suppose we begin with an equilibrium in this market, where quantity produced is equal to quantity demanded, which is equal to 5 million tons of oranges. Further suppose the price of a pound of oranges is $2.50. a. Illustrate this equilibrium by using supply and demand curves. Don't forget to label the axes, show the equilibrium quantity and the equilibrium price. (5 pts) b. Now suppose a tropical storm hits Florida destroying...
 het happens to equilibrium price and quantity in the market 50 pickup irucks if the price of Chevy Silverado pickup trucks goes fown. Show a graph of label each axis and the demand and supply curves. ply for Ford F150 and be sure to properly Please state what will happen to the current equilibrium price and quantity in the market for gasoline if there is an expectation of higher gasoline prices in the immediate future. Show a graph of demand/supply...
 12. A market is said to be in equilibrium when: A Quantity demanded equals quantity supplied B. Production costs equal revenues from sale of the output C. The number of sellers equals the number of buyers D. People's needs are fully met 13. At the equilibrium prices: A. There are shortages but no surpluses B. There are surpluses but no shortages C. The economic problem of scarcity is no longer relevant D. There are no shortages or surpluses 14. An...
 1. Evaluate whether the statement is true or false. Explain why Competitive firm never produces when it is making a negative profit. a. b. In cost minimization, as wage increases, a firm will always decreases labour input Long run market supply curve in perfect competition is horizontal C. d. If price is lower than equilibrium price, consumer surplus is higher than the equilibrium since consumers can enjoy lower price.
1. Evaluate whether the statement is true or false. Explain why...
1. Evaluate whether the statement is true or false. Explain why Competitive firm never produces when it is making a negative profit. a. b. In cost minimization, as wage increases, a firm will always decreases labour input Long run market supply curve in perfect competition is horizontal C. d. If price is lower than equilibrium price, consumer surplus is higher than the equilibrium since consumers can enjoy lower price.
1. Evaluate whether the statement is true or false. Explain why...
 Q=100,000-10,000P solve for the consumer surplus at the
equilibrium price and quantity
Demand: Let the Market Demand curve for soybeans be given by the following equation: Q=100,000 -10,000P where the quantity of soybeans in kilograms P = the price of soybeans in dollars per kilogram. Supply: Let the Market Supply curve for soybeans be given by the equation: Q=-5,000+ 5,000P 3) Consumer Surplus: The Consumer Surplus (CS) is the triangular area under the demand curve and above the equilibrium price....
Q=100,000-10,000P solve for the consumer surplus at the
equilibrium price and quantity
Demand: Let the Market Demand curve for soybeans be given by the following equation: Q=100,000 -10,000P where the quantity of soybeans in kilograms P = the price of soybeans in dollars per kilogram. Supply: Let the Market Supply curve for soybeans be given by the equation: Q=-5,000+ 5,000P 3) Consumer Surplus: The Consumer Surplus (CS) is the triangular area under the demand curve and above the equilibrium price....
Most questions answered within 3 hours.
-
python
Define a function called print_values which takes a dictionary
object as a parameter. The function...
asked 44 minutes ago -
In Chapter 1 you created a program named Triangle in
which you displayed a seven-line triangle...
asked 39 minutes ago -
Research question: What are the differences between separately
stated and non separately stated transactions in an...
asked 1 hour ago -
By using Arduino write a code that connects two LEDs to two
push-buttons. Each button controls...
asked 2 hours ago -
Bank of America has bonds that pay a coupon interest rate of 5.5
percent and mature...
asked 2 hours ago -
Problem: Patient Fees C++
You are to write a program that computes a patient’s bill for...
asked 4 hours ago -
In a population of interest, we know that, 77% drink coffee, and
23% drink tea. Assume...
asked 4 hours ago -
Given that f(x) = e-(x-1) for x > 1, determine the following
probabilities:
a) P(X <...
asked 4 hours ago -
A mechanic pushes a 2.60 ✕ 103-kg car from rest to a speed of v,
doing...
asked 4 hours ago -
International information systems result in all of the following
except:
A. improved quality of information flow....
asked 4 hours ago -
The president of the retailer Prime Products has just approached
the company’s bank with a request...
asked 4 hours ago -
If the carrying amount is $200,000 and recoverable amount is
$205000, the impairment amount is:
Select...
asked 4 hours ago