

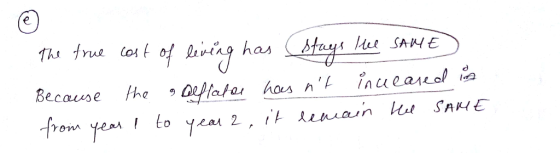
Need help, please show work. Options for each blank are (doubles, stayed the same, or fallen by half). EXCEPT, the options for the blank at E are (increased, decreased, or stays the same).
Homework Answers


Add Answer to:
Need help, please show work. Options for each blank are
(doubles, stayed the same, or fallen...
Need help, please show work. Options for each blank are (doubles, stayed the same, or fallen...
 Need help, please show work. Options for each blank are
(doubles, stayed the same, or fallen by half). EXCEPT, the options
for the blank at E are (increased, decreased, or stays the
same).
Answers marked in red are incorrect.
Abby consumes only apples. In year 1, red apples cost $1 each, green apples cost $2 each, and Abby buys 10 red apples. In year 2, red apples cost $2 each, green apples cost $1 each, and Abby buys 10 green...
Need help, please show work. Options for each blank are
(doubles, stayed the same, or fallen by half). EXCEPT, the options
for the blank at E are (increased, decreased, or stays the
same).
Answers marked in red are incorrect.
Abby consumes only apples. In year 1, red apples cost $1 each, green apples cost $2 each, and Abby buys 10 red apples. In year 2, red apples cost $2 each, green apples cost $1 each, and Abby buys 10 green...
Need help with the answers marked red (they are incorrect). Please don't say the cpi for...
 Need help with the answers marked red (they are incorrect).
Please don't say the cpi for year 1 is 100 (that is incorrect
according to this). Please show work.
The Data of Macroeconomics-End of Chapter Problenm Abby consumes only apples. In year 1, red apples cost $1 each, green apples cost $2 each, and Abby buys 10 red apples. In year 2, red apples cost $2 each, green apples cost $1 each, and Abby buys 10 green apples. Assume that...
Need help with the answers marked red (they are incorrect).
Please don't say the cpi for year 1 is 100 (that is incorrect
according to this). Please show work.
The Data of Macroeconomics-End of Chapter Problenm Abby consumes only apples. In year 1, red apples cost $1 each, green apples cost $2 each, and Abby buys 10 red apples. In year 2, red apples cost $2 each, green apples cost $1 each, and Abby buys 10 green apples. Assume that...
Need help with this, CORRECT ANSWERS ARE ALREADY SHOWN. All I need to know is how...
 Need help with this, CORRECT ANSWERS ARE ALREADY SHOWN. All I
need to know is how to arrive at these answers, please show
work
The Data of Macroeconomics-End of Chapter Problem Abby consumes only apples. In year 1, red apples cost $1 each, green apples cost $2 each, and Abby buys 10 red apples. In year 2, red apples cost $2 each, green apples cost $1 each, and Abby buys 10 green apples. Assume that year 1 is the base...
Need help with this, CORRECT ANSWERS ARE ALREADY SHOWN. All I
need to know is how to arrive at these answers, please show
work
The Data of Macroeconomics-End of Chapter Problem Abby consumes only apples. In year 1, red apples cost $1 each, green apples cost $2 each, and Abby buys 10 red apples. In year 2, red apples cost $2 each, green apples cost $1 each, and Abby buys 10 green apples. Assume that year 1 is the base...
Abby consumes only apples. Year 1 Year 2 red $1 each $2 each green $2 each...
Abby consumes only apples. Year 1 Year 2 red $1 each $2 each green $2 each $1 each In year 1 Abby buys 10 red apples and in Year 2 Abby buys 10 green apples. Compute a CPI for apples for each year. Assume that year 1 is the base year in which the consumer basket is fixed. How does your index change from year 1 to year 2? (at least five sentences to explain) Suppose Abby is happy eating...
#7 please 2010 Good Quantity Hot dogs 200 Hamburgers 200 2018 Price Quantity $ 2 250...
 #7 please
2010 Good Quantity Hot dogs 200 Hamburgers 200 2018 Price Quantity $ 2 250 $3 500 Price $4 54 c. Apple sells a computer to a bakery in Paris, France. d. Apple sells a computer to Paris Hilton. e. Apple builds a computer to be sold next year. Find data on GDP and its components and compute the percentage of GDP for the following components for 1950, 1990, and the most recent year available. a. Personal consumption expenditures...
#7 please
2010 Good Quantity Hot dogs 200 Hamburgers 200 2018 Price Quantity $ 2 250 $3 500 Price $4 54 c. Apple sells a computer to a bakery in Paris, France. d. Apple sells a computer to Paris Hilton. e. Apple builds a computer to be sold next year. Find data on GDP and its components and compute the percentage of GDP for the following components for 1950, 1990, and the most recent year available. a. Personal consumption expenditures...
Need help, please show work The Data of Macroeconomics-Work It Out Question 2 Consider an economy...
 Need help, please show work
The Data of Macroeconomics-Work It Out Question 2 Consider an economy that produces and consumes bread and automobiles. The table includes data for two different years. Good 20102010 2015 2015 QuantityriceQuantityPrice Automobiles| 70 $44000110 65000 Bread 530000$10 Round answers to to places afier the decimal where necessary a. Using 2010 as the base year, compute nominal GDP, real GDP, the implicit price deflator for GDP, and the CPI for each year 2010 Nominal GDP 2015...
Need help, please show work
The Data of Macroeconomics-Work It Out Question 2 Consider an economy that produces and consumes bread and automobiles. The table includes data for two different years. Good 20102010 2015 2015 QuantityriceQuantityPrice Automobiles| 70 $44000110 65000 Bread 530000$10 Round answers to to places afier the decimal where necessary a. Using 2010 as the base year, compute nominal GDP, real GDP, the implicit price deflator for GDP, and the CPI for each year 2010 Nominal GDP 2015...
technology is known as _____ unemployment. Question 6 options: a) structural b) seasonal c) cyclical d)...
technology is known as _____ unemployment. Question 6 options: a) structural b) seasonal c) cyclical d) frictional The nominal value of wages explains how much a consumer can pay for goods and services. Question 7 options: a) True b) False The consumer price index does NOT include: Question 8 options: a) the price of a haircut. b) apartment rental rates. c) the price of milk. d) property taxes. If the nominal GDP is $13 trillion for a given year and...
Can you please fill out all of the questions for whoever does it the last person...
 Can
you please fill out all of the questions for whoever does it the
last person onky dis half of it.
Question 1 20 pts The table below shows production and prices for a stylized economy. Assume the base year is 2015. Auction Price of Y($) of Z i Year Production Price of X of X ($) Production n of Y Production Price of Z ($) 2015 275 units 15 180 units 23 135 units 80 2016 330 units 15.75...
Can
you please fill out all of the questions for whoever does it the
last person onky dis half of it.
Question 1 20 pts The table below shows production and prices for a stylized economy. Assume the base year is 2015. Auction Price of Y($) of Z i Year Production Price of X of X ($) Production n of Y Production Price of Z ($) 2015 275 units 15 180 units 23 135 units 80 2016 330 units 15.75...
Question 11 44 pts Assume that an economy produces only three goods; Computers, cars, and pizza. Table 1 gives the price and quantity for each good and the number of employed and unemployed individuals for the years 2017-2020. Table 2 gives the fixed bask
 Question 11 44 pts Assume that an
economy produces only three goods; Computers, cars, and pizza. Table 1
gives the price and quantity for each good and the number of employed
and unemployed individuals for the years 2017-2020. Table 2 gives the
fixed basket used for calculating the CPI. Assume that the base year is
2018! Table 1 - Price and Quantity of Goods Sold in 2017-2020 2017 2018
2019 2020 Р Q 20 Q 15 Computers Р $400/unit $18,000/unit...
Question 11 44 pts Assume that an
economy produces only three goods; Computers, cars, and pizza. Table 1
gives the price and quantity for each good and the number of employed
and unemployed individuals for the years 2017-2020. Table 2 gives the
fixed basket used for calculating the CPI. Assume that the base year is
2018! Table 1 - Price and Quantity of Goods Sold in 2017-2020 2017 2018
2019 2020 Р Q 20 Q 15 Computers Р $400/unit $18,000/unit...
Assume that an economy produces only three goods; Computers, cars, and pizza. Table 1 gives the price and quantity for each good and the number of employed and unemployed individuals for the years 2010-2013. Table 2 gives the fixed basket used for calcula
 Assume that an economy produces
only three goods; Computers, cars, and pizza. Table 1 gives the price
and quantity for each good and the number of employed and unemployed
individuals for the years 2010-2013. Table 2 gives the fixed basket used
for calculating the CPI. Assume that the base year is 2011 and show
your work! Table 1 - Price and Quantity of Goods Sold in 2010-2013 2010
2011 2012 2013 P Q P O P Q 25 Computers Cars...
Assume that an economy produces
only three goods; Computers, cars, and pizza. Table 1 gives the price
and quantity for each good and the number of employed and unemployed
individuals for the years 2010-2013. Table 2 gives the fixed basket used
for calculating the CPI. Assume that the base year is 2011 and show
your work! Table 1 - Price and Quantity of Goods Sold in 2010-2013 2010
2011 2012 2013 P Q P O P Q 25 Computers Cars...
 Need help, please show work. Options for each blank are
(doubles, stayed the same, or fallen by half). EXCEPT, the options
for the blank at E are (increased, decreased, or stays the
same).
Answers marked in red are incorrect.
Abby consumes only apples. In year 1, red apples cost $1 each, green apples cost $2 each, and Abby buys 10 red apples. In year 2, red apples cost $2 each, green apples cost $1 each, and Abby buys 10 green...
Need help, please show work. Options for each blank are
(doubles, stayed the same, or fallen by half). EXCEPT, the options
for the blank at E are (increased, decreased, or stays the
same).
Answers marked in red are incorrect.
Abby consumes only apples. In year 1, red apples cost $1 each, green apples cost $2 each, and Abby buys 10 red apples. In year 2, red apples cost $2 each, green apples cost $1 each, and Abby buys 10 green...
 Need help with the answers marked red (they are incorrect).
Please don't say the cpi for year 1 is 100 (that is incorrect
according to this). Please show work.
The Data of Macroeconomics-End of Chapter Problenm Abby consumes only apples. In year 1, red apples cost $1 each, green apples cost $2 each, and Abby buys 10 red apples. In year 2, red apples cost $2 each, green apples cost $1 each, and Abby buys 10 green apples. Assume that...
Need help with the answers marked red (they are incorrect).
Please don't say the cpi for year 1 is 100 (that is incorrect
according to this). Please show work.
The Data of Macroeconomics-End of Chapter Problenm Abby consumes only apples. In year 1, red apples cost $1 each, green apples cost $2 each, and Abby buys 10 red apples. In year 2, red apples cost $2 each, green apples cost $1 each, and Abby buys 10 green apples. Assume that...
 Need help with this, CORRECT ANSWERS ARE ALREADY SHOWN. All I
need to know is how to arrive at these answers, please show
work
The Data of Macroeconomics-End of Chapter Problem Abby consumes only apples. In year 1, red apples cost $1 each, green apples cost $2 each, and Abby buys 10 red apples. In year 2, red apples cost $2 each, green apples cost $1 each, and Abby buys 10 green apples. Assume that year 1 is the base...
Need help with this, CORRECT ANSWERS ARE ALREADY SHOWN. All I
need to know is how to arrive at these answers, please show
work
The Data of Macroeconomics-End of Chapter Problem Abby consumes only apples. In year 1, red apples cost $1 each, green apples cost $2 each, and Abby buys 10 red apples. In year 2, red apples cost $2 each, green apples cost $1 each, and Abby buys 10 green apples. Assume that year 1 is the base...
 #7 please
2010 Good Quantity Hot dogs 200 Hamburgers 200 2018 Price Quantity $ 2 250 $3 500 Price $4 54 c. Apple sells a computer to a bakery in Paris, France. d. Apple sells a computer to Paris Hilton. e. Apple builds a computer to be sold next year. Find data on GDP and its components and compute the percentage of GDP for the following components for 1950, 1990, and the most recent year available. a. Personal consumption expenditures...
#7 please
2010 Good Quantity Hot dogs 200 Hamburgers 200 2018 Price Quantity $ 2 250 $3 500 Price $4 54 c. Apple sells a computer to a bakery in Paris, France. d. Apple sells a computer to Paris Hilton. e. Apple builds a computer to be sold next year. Find data on GDP and its components and compute the percentage of GDP for the following components for 1950, 1990, and the most recent year available. a. Personal consumption expenditures...
 Need help, please show work
The Data of Macroeconomics-Work It Out Question 2 Consider an economy that produces and consumes bread and automobiles. The table includes data for two different years. Good 20102010 2015 2015 QuantityriceQuantityPrice Automobiles| 70 $44000110 65000 Bread 530000$10 Round answers to to places afier the decimal where necessary a. Using 2010 as the base year, compute nominal GDP, real GDP, the implicit price deflator for GDP, and the CPI for each year 2010 Nominal GDP 2015...
Need help, please show work
The Data of Macroeconomics-Work It Out Question 2 Consider an economy that produces and consumes bread and automobiles. The table includes data for two different years. Good 20102010 2015 2015 QuantityriceQuantityPrice Automobiles| 70 $44000110 65000 Bread 530000$10 Round answers to to places afier the decimal where necessary a. Using 2010 as the base year, compute nominal GDP, real GDP, the implicit price deflator for GDP, and the CPI for each year 2010 Nominal GDP 2015...
 Can
you please fill out all of the questions for whoever does it the
last person onky dis half of it.
Question 1 20 pts The table below shows production and prices for a stylized economy. Assume the base year is 2015. Auction Price of Y($) of Z i Year Production Price of X of X ($) Production n of Y Production Price of Z ($) 2015 275 units 15 180 units 23 135 units 80 2016 330 units 15.75...
Can
you please fill out all of the questions for whoever does it the
last person onky dis half of it.
Question 1 20 pts The table below shows production and prices for a stylized economy. Assume the base year is 2015. Auction Price of Y($) of Z i Year Production Price of X of X ($) Production n of Y Production Price of Z ($) 2015 275 units 15 180 units 23 135 units 80 2016 330 units 15.75...
Most questions answered within 3 hours.
-
A solid, uniform disk of radius 0.250 m and mass 53.7 kg rolls
down a ramp...
asked 2 hours ago -
Given the following table of high speed internet access vs.
annual home income:
Home Income
%...
asked 2 hours ago -
A baseball batter hits a 0.145kg baseball straight up into the
air. The baseball leaves the...
asked 3 hours ago -
An FM modulator is tested using
single-tone baseband signal with frequency of 50kHz and a sprectrum...
asked 3 hours ago -
Write the ionic equations for the first stage of salts
hydrolysis.
Anion, Cation?
Na2S
NiSO4
K2SO4...
asked 5 hours ago -
suppose there is a normally distributed population with a mean of
250 and a standard deviation...
asked 5 hours ago -
Question Three
Suppose you as project manager are using the Waterfall
development methodology on a large...
asked 6 hours ago -
Which statement is not true about welfare in Canada?
A.Benefits typically vary based on one's ability...
asked 7 hours ago -
Please help me with FLOWCHART and UML diagram for class,
thank you!
#include <iostream>
#include <fstream>...
asked 8 hours ago -
3. Describe the “logic circuit” of the Lac operon. Which
proteins are bound or not to...
asked 8 hours ago -
Ayesha’s adjusted gross income is $60,000 in 2019. She donated a
piece of artwork with a...
asked 8 hours ago -
For Dijkstra’s shortest path algorithm:
a. Give the Big-O time for Dijkstra’s shortest path algorithm
and...
asked 8 hours ago